

Introduction
Materials and Methods
Experiment field and climate
Experimental design
Field preparation and division
Seeding of legumes and incorporation of green manure into the soil
Chemical analysis on soil samples
Analysis of biomass produced from legumes
Corn cultivation and data collection
Results and Discussion
The biomass of legumes produced
The change of soil properties by the GM incorporation
The green manures to the corn plant height
The green manures to the corn stalk diameter
The green manures to the corn leaf area
The green manures to the corn leaf area index
The green manures to the corn productivity
Conclusion
Introduction
Corn holds a vital role in Mozambique’s agricultural landscape, serving as a staple food crop crucial for sustenance and augmenting family incomes. With over 95% of cultivated areas in the family sector dedicated to corn production, its significance cannot be overstated (Carvalho et al., 2015). However, despite its prominence, corn yields have remained relatively low, ranging between 500 and 1,500 kg/ha from 2005 to 2022, significantly lagging behind other corn-cultivating African countries, some of which achieve yields up to 5,000 kg/ha (USDA/NASS, 2023). This discrepancy in yields can be attributed to various factors, including the high costs of commercial inputs such as fertilizers, pesticides, and herbicides, coupled with the limited financial capacity of rural farmers (Florentín et al., 2010). Consequently, only a small fraction of farmers, approximately 5%, utilize fertilizers to maintain corn productivity (Waddington, 2003). Therefore, underdeveloped countries need a way to obtain the effects of fertilizers from nature rather than purchasing costly fertilizers.
Incorporating green manure (GM) emerges as a promising solution to counteract the decline in corn productivity within the family sector. This practice, conceptualized since ancient times, involves utilizing plants in rotation or intercropping with economically significant crops, with their residues either incorporated into the soil or maintained on the surface (Ambrosano et al., 2013). GM offers multifaceted benefits, including enhancing soil’s physical, chemical, and biological characteristics and facilitating the control of invasive plants.
Given nitrogen’s pivotal role in corn’s nutrient uptake and grain productivity, utilizing nitrogen-fixing plants or those capable of recycling atmospheric nitrogen presents a strategic approach to fulfilling corn’s nitrogen requirements. Leguminous are well discussed for the GM, which can provide nitrogen through symbiotic fixation or nutrient recycling. The legumes are known for tolerance to drought and low fertility soil conditions, rapid growth, high production of biomass, high nutrient content (N, P, K, etc.), good adaptation to climate change, low susceptibility to pests and diseases, low cost and easy access in Mozambique. Moreover, the nitrogen-fixing properties of leguminous species, through symbiosis with bacteria of the genus Rhizobium/Bradyrhizobium in the roots, enrich the soil with this essential macronutrient, thereby benefiting subsequent crops, particularly corn (Partey et al., 2014). Organic nitrogen, as maintained in organic form through GM, exhibits reduced susceptibility to losses through leaching or volatilization, thereby ensuring a more gradual release in accordance with the mineralization of plant residues (Astier et al., 2006).
The objectives aim to quantify the efficacy of incorporating leguminous varieties as GM in improving soil quality and supporting sustainable corn production. The objectives include characterizing soil chemical variables before and after GM incorporation, determining GM biomass production, and assessing corn crop development parameters based on different GM varieties. Ultimately, this research encourages the widespread adoption of organic fertilizers in family farming practices, recognizing their long-term benefits and environmental sustainability within conservation agriculture.
Materials and Methods
Experiment field and climate
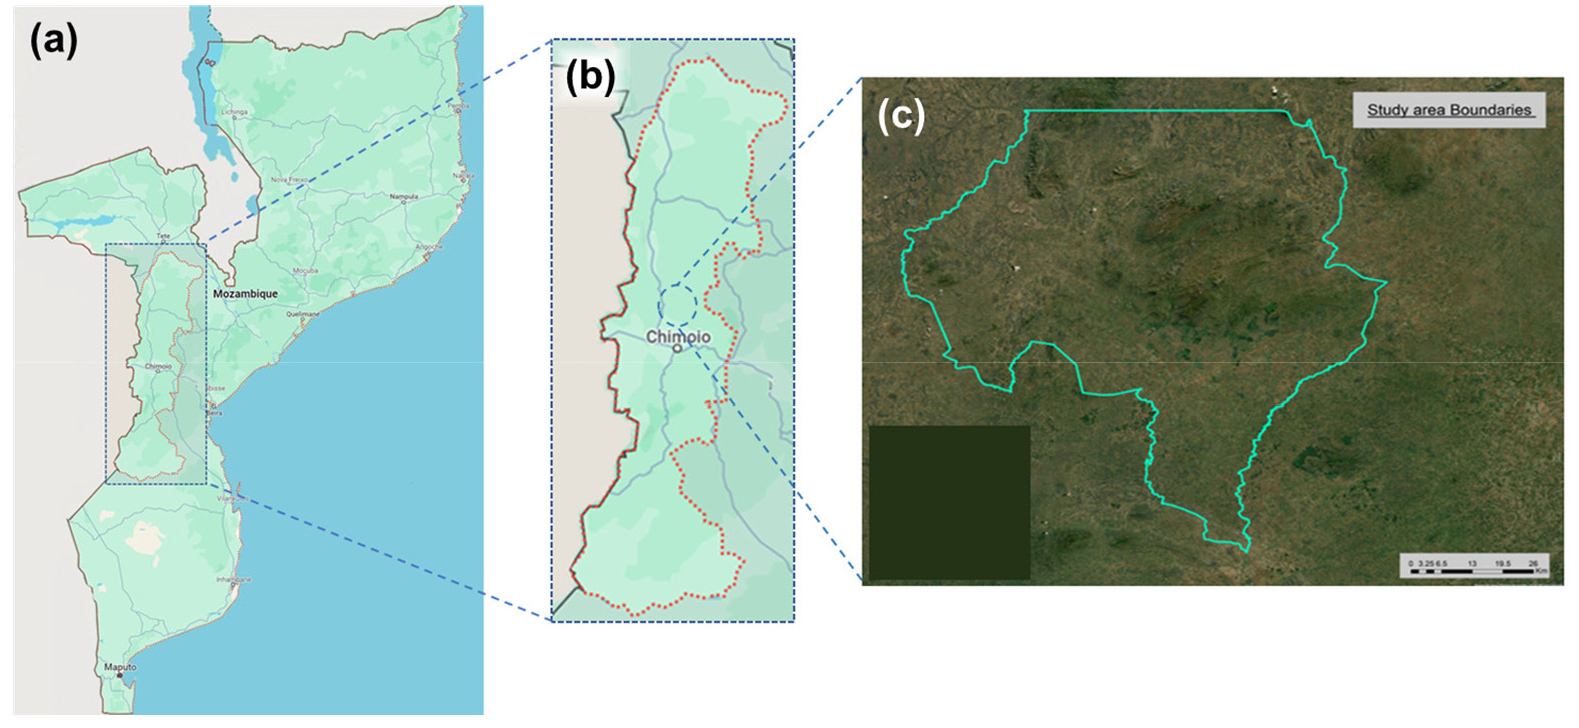
The experiment was carried out near the city of Chimoio, Manica Province, in Mozambique (19° 06′ 59″ S latitudes and 33° 29′ 00″ W longitudes). The experimental area was 347 m2, with an elevation of 702.94 m above sea level (Fig. 1). The experiment took place over 10 months, from November 2022 to August 2023. Regarding the climate, the coldest months were June to August, with temperatures ranging from 9 to 11°C, while October was the highest to 32°C. The relative humidity of the air was 67.4% on average. The monthly rainfall from Nov. 2022 to Feb. 2023 ranged between 12.8 and 495 mm, with the lowest rainfall observed in April and May ranged 12.8 and 35.7 mm, respectively.
Experimental design
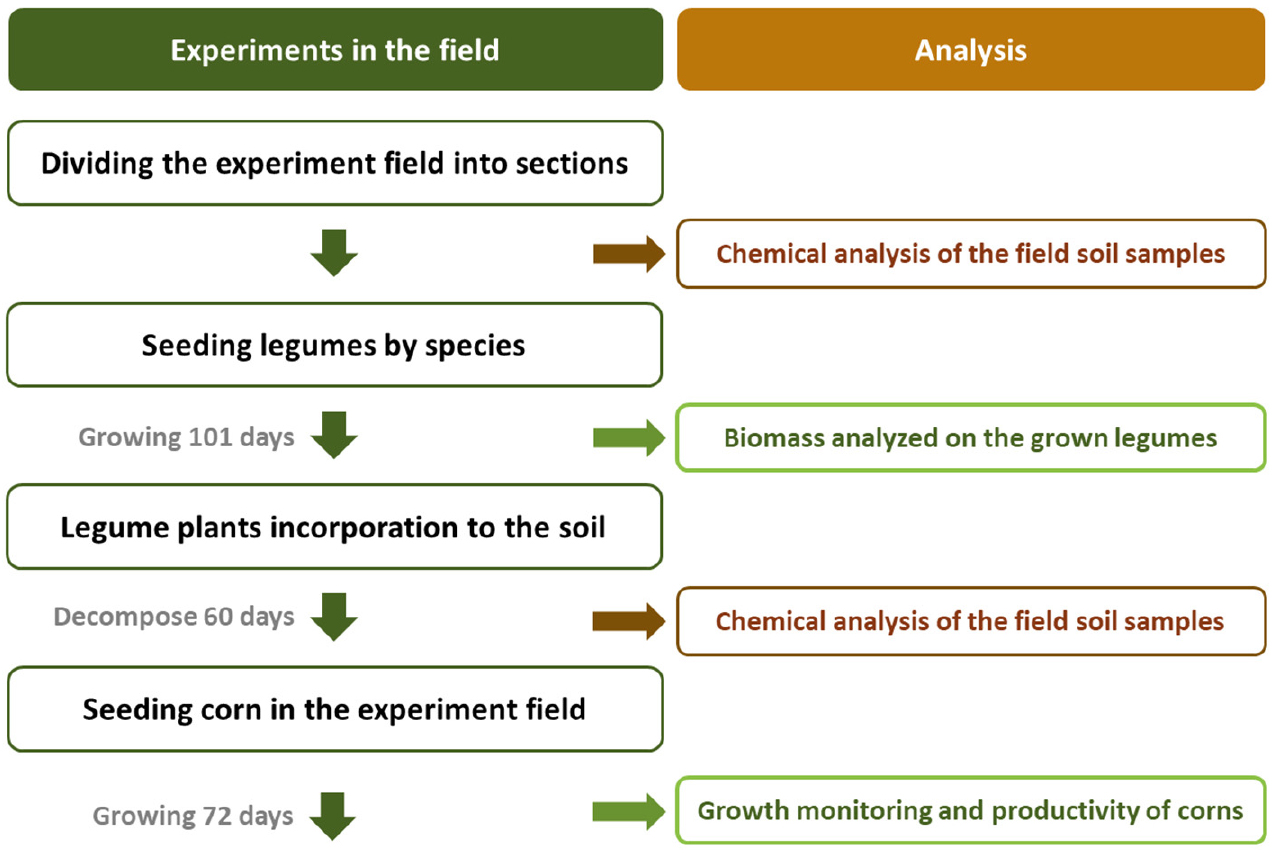
This research involved field experiments and laboratory analysis. The field experiment included growing legumes, using them for GM, and cultivating corn. In the laboratory, the biomass of legumes, soil chemical characteristics, and productivity of grown corn were analyzed (Fig. 2).
The experiment started by dividing the field into 20 sections, analyzing the nutritional components of soil, growing and analyzing the biomass of legumes, incorporating legumes into the soil, analyzing soil nutrition change, and analyzing the growth and productivity of corn seeded in each section.
Field preparation and division
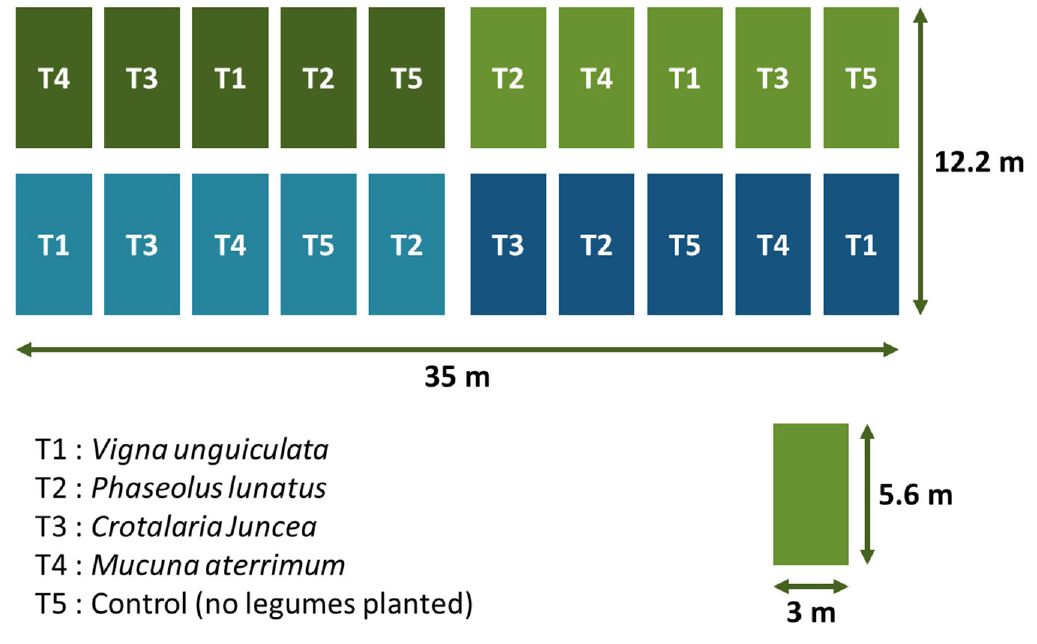
Plowing and harrowing prepared the soil for the experiment’s implementation. Then, the sections and their respective plots were divided. The plots and furrows had a depth of 8 cm. The field was divided into 4 blocks with 5 sections based on the randomized complete block design (RCBD) to decrease the experimental error and by grouping the experimental units into blocks. Each section was for 5 treatments for seeding 4 kinds of legumes and control without growing any plant with 4 replications. The section area was 16.8 m2 and had a spacing of 0.5 m between (Fig. 3).
Seeding of legumes and incorporation of green manure into the soil
The legumes (V. unguiculata, P. lunatus, C. juncea, and M. aterrima) were seeded manually in Nov. 2022. Spacing between seeds was 50 cm and 75 cm for rows and columns to have a density of 67 plants in each section. Two seeds were deposited per hole at a depth not exceeding 5 cm. All species were seeded without basic or top dressing. Emergence occurred 3 days after seeding for C. juncea and V. unguiculata, 5 days after seeding for P. lunatus, and 7 days after seeding M. aterrima.
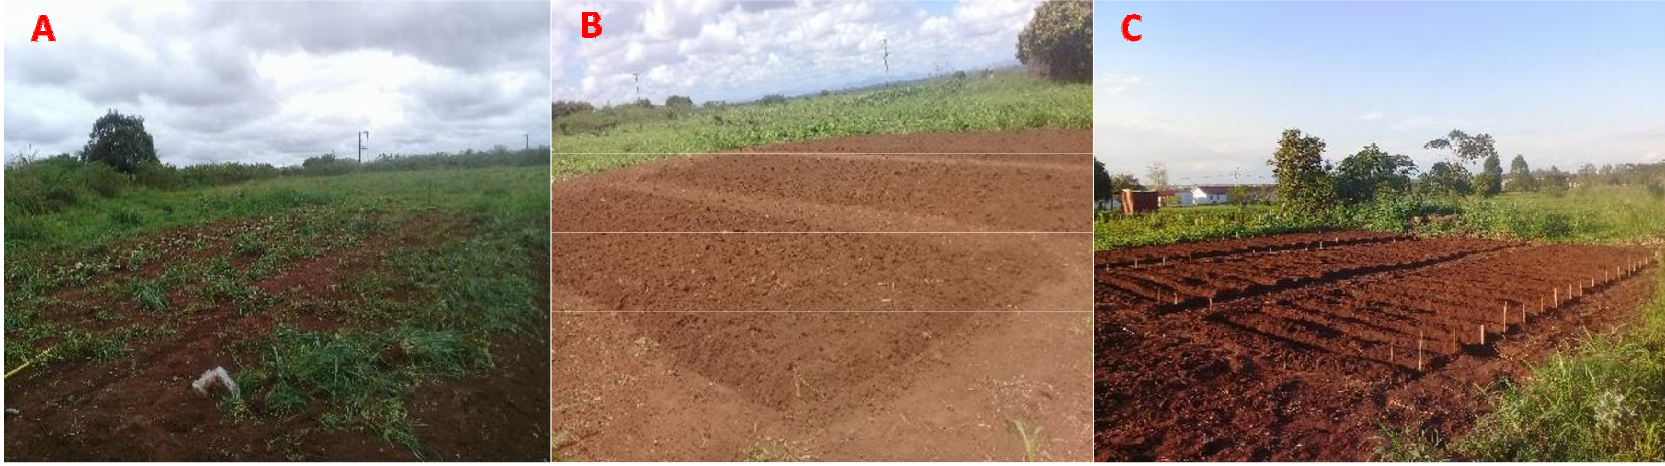
The grown legume plants were incorporated into the soil 101 days after seeding. At this period, M. aterrima and P. lunatus were in full flowering, and V.unguiculata and C. juncea were in full flowering with pod formation. A tractor attached with a grid disc was used to incorporate the grown plants into the soil at a depth of 20 cm. The field images of the incorporated legumes, section division, and preparation to seed corn are presented in Fig. 4.
Chemical analysis on soil samples
The chemical analyses of the soil were carried out twice: before seeding legumes and 60 days after the grown legumes had decomposed in the soil. Each soil sample of 500 g was collected from each section at a depth of 20 cm at 10 different points. The soil sample from the same legume variety was mixed and homogenized. Stones, plant remains, and roots were not considered to collect. Samples were stored in a polyethylene bag and sent to the laboratory to determine pH, organic matter (OM), phosphorus (P), potassium (K), calcium (Ca), sodium (Na), and carbon-nitrogen ratio (C/N) (DER-FAEF, 2023).
Analysis of biomass produced from legumes
After 101 days before the incorporation in the soil, the legumes were cut from the stem and collected from 1 m2 in each section to determine biomass production. The process was carried out in the pre-flowering phase, where samples were collected when dew could not interfere with the results. The weight was measured before and after drying to determine the dry matter.
Corn cultivation and data collection
Corn (PAN53 var.) was seeded 60 days after the legumes were incorporated into the soil. Seeding was done manually at a depth of no more than 3 cm, using 2 seeds for each hole, with a spacing of 30 cm and 80 cm for row and column. Each section consisted of 7 rows comprising 10 plants, equivalent to 70 plants per section. The emergence occurred on day 4 to 7 after the seeding. Thinning was carried out, and the corn was grown for 72 days.
Plant height, stalk diameter, leaf area, and leaf area index were determined 30 days after emergence. This process was repeated once weekly on day 30, 37, 44, 51, 58, 65, and 72 until the crops were in the bolting phase. Plant height measurements were obtained by measuring the distance between the plant’s base and the slope’s apex, individually and randomly. Stalk diameter was measured using a caliper at a height approximately 10 cm from the ground level. Then, the arithmetic means of the stem diameter were found by dividing the total measurements by the number of plants observed (Salahin et al., 2013). The length and maximum width of all plant leaves in each section’s lower, middle, and upper parts of the vegetative canopy of 10 plants were collected. The average lengths and widths were determined to find the leaf area (AF) and the leaf area index (IAF) by Eq. 1 and 2 (Reis et al., 2013). The IAF was calculated through estimates of the relationship between AF and the space occupied by plants, which was 2.4 cm2.
Where,
C: The corn leaf length
W: The maximum corn leaf width
0.75: Correction coefficient for determining corn leaf area
The productivity of corn grain was analyzed by collecting 3 plants in every 4 m². Those samples were dried to have a moisture content of 15.5%. The number of ears of corn in each area, the number of rows of grains, and the number of corn grains per row of each ear were analyzed. After data collection, the corn productivity was determined using the “Corn Yield Calculator” by Eq. 3 (Bruna, 2019). The trial data were statistically processed with single factor analysis of variance (ASSISTAT 7.7) and correlation analysis at a 5% significance level.
Where,
P: Corn productivity
NE: Average number of ears in 4 m²
NR: Number of grain rows
NG: Number of grains per row of each ear
0.70: Correction factor and transformation of bushels/acre to kg/ha
The data gathered during corn growth were analyzed using Tukey’s test to compare the impact of legume varieties. The biomass of legumes, and the corn data (plant height, stem diameter, leaf area, leaf area index, productivity) were compared at a 5% probability.
Results and Discussion
The biomass of legumes produced
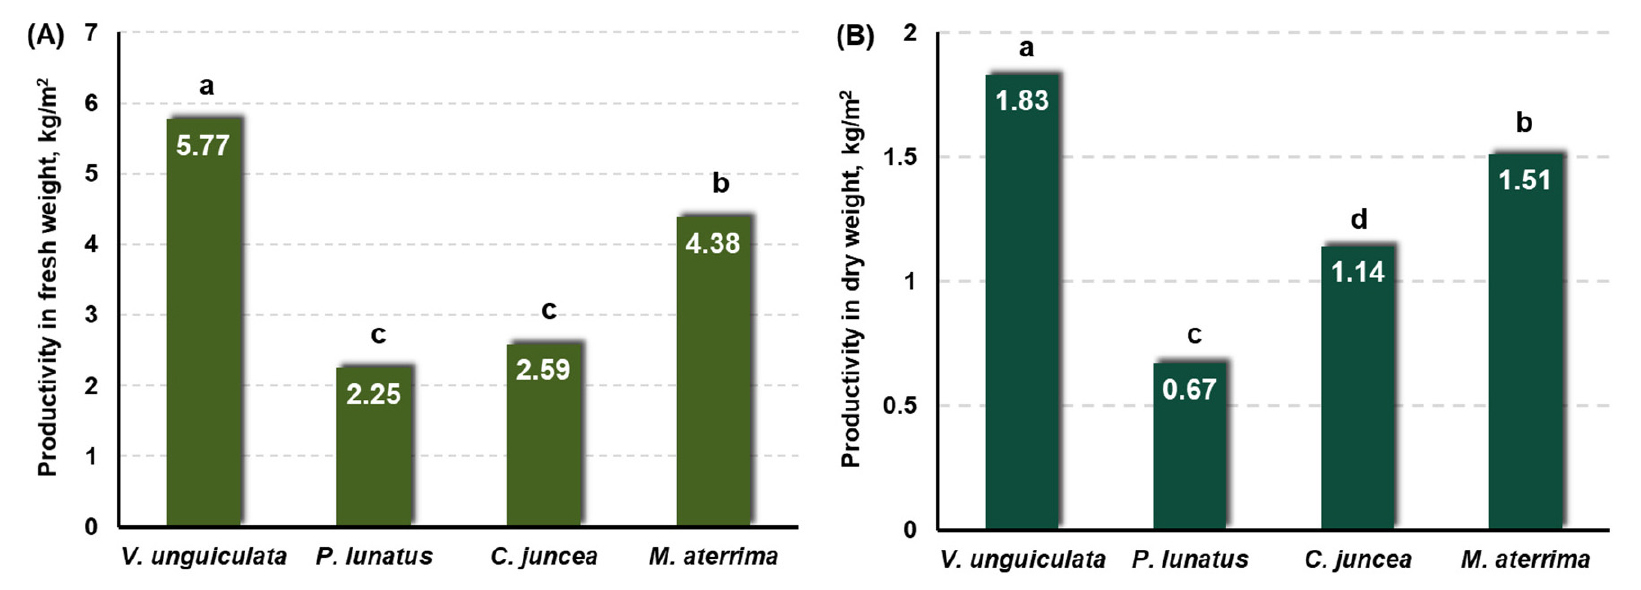
Comparing the biomass of grown legumes for GM, it was found that there was a significant difference between varieties. The V. unguiculata exhibited the highest biomass productivity, yielding 5.77 kg/m2 (57.7 tons/ha) of fresh mass and 1.83 kg/m2 (18.3 tons/ha) of dry mass. This was significantly higher than M. aterrima (4.38 kg/m2 fresh, 1.51 kg/m2 dry) and C. juncea (2.59 kg/m2 fresh, 1.14 kg/m2 dry), indicating V. unguiculata superior adaptability and efficiency in biomass accumulation under the given conditions. P. lunatus had the lowest result, with 2.25 kg/m2 (22.5 tons/ha) of fresh mass and 0.67 kg/m2 (6.7 tons/ha) of dry mass, which could be attributed to its slower growth rate and lower efficiency in nutrient uptake under the experimental conditions (Fig. 5). This result may have been caused by the characteristics of varieties and influenced by late germination and the flowering stage. These results differ from those in other studies where P. lunatus surpassed M. aterrima and C. juncea biomass production (Ziblim et al., 2013).
The change of soil properties by the GM incorporation
The chemical analysis results explain the changes in the soil properties by the legume incorporation (Table 1). Organic matter levels increased (3.69%) in soil cultivated with the legume V. unguiculata, followed by M. aterrima, C. juncea, and P. lunatus. N, C, and C/N contents significantly increased in soil cultivated with V. unguiculata. The highest potassium (K) content (0.38%) was obtained in soil cultivated with the legume M. aterrima. The highest phosphorus (P) content was found in soil cultivated with P. lunatus, and the highest sodium (Na) content was obtained in soil that constituted C. juncea. The V. unguiculata stood out the most, followed by those cultivated with M. aterrima, observing a major increase in those chemical properties. This fact can be attributed to the greater biomass productivity of the incorporated legumes and their decomposition since V. unguiculata and M. aterrima obtained more biomass.
These low control values could have been obtained because the soil was kept fallow, there was a loss of nutrients through leaching, and the weeds consumed the existing nutrients, which could have resulted in a decrease in nutrients (Kamil et al., 2009). These results differ from the results obtained by other research, which stated that after a year of incorporation of 5 legumes in a sandy phase Oxisol, the balance had not yet been reached in terms of some chemical characteristics, despite there having been a significant increase in the organic matter content (Karyoti et al., 2018). Studying GM as an exclusive source of nutrients for corn crops obtained high nutrient values in soils cultivated with M. aterrima and C. juncea (53 and 30 of potassium, 14 and 10 of phosphorus) in two years of testing (Nunes et al., 2011). The nutrient levels found in the present work were lower than the others due to the time elapsed during the incorporation of legumes, which was insufficient for adequate decomposition of the organic material.
In Table 1, the average values obtained for the variable pH (H2O) and pH (KCl) in different legumes are found, with averages varying between 6.4 and 6.7 in water and 4.1 and 5.1 in KCl. The statistical analysis of these data showed significant differences at the 5% probability level using the Tukey test for the GM with different legumes, which presented better values from a statistical point of view. These results can be understood as the areas with the best pH (H2O) and pH (KCl) values present the best physical structure of the soil, thus facilitating the reduction of acid content and improving the performance of existing microorganisms and nutrients on the soil.
Potential acidity mainly represents the fraction of H+ and Al3+ that can be solubilized according to the chemical balance resulting from changes in soil pH. Therefore, the values obtained for pH (H2O) and pH (KCl) culminate in a wide variation of potential acidity (H+ + Al3+). It is important to obtain potential acidity values as low as possible, as in this way, there will be a lower level of Al contained in the soil, an element that, in high quantities, can cause serious problems to the soil. Therefore, the results obtained are in accordance with (Ebeling et al., 2008) who state that plant materials held in the soil can increase pH and reduce Al3+ content.
Table 1.
Soil chemical characteristic changes before and after incorporation of green manures.
The analysis of variance data found that GM had a significant influence at a 5% probability level on all analyzed parameters. The significance of the evaluated parameters is probably the result of the influence of the incorporation of GM into the soil, which helped the crops make the most of the nitrogen deposited by the legumes. In biological nitrogen fixation, legumes have a lower C/N ratio than grasses, which promotes rapid decomposition and the consequent release of nitrogen nutrients (Sinha et al., 2009). Some legumes can break through compacted layers and absorb nutrients from subsurface layers, favoring nutrient recycling (Ravindra et al., 2014).
The green manures to the corn plant height
Using statistical analysis, it was observed that the highest growth rate for plant height from 51 days to 72 days (Table 2) was influenced by GM. Comparing the average heights, a greater plant height was found in the treatment consisting of V. unguiculata (210.63 cm) followed by P. lunatus, M. aterrima, C. juncea, and finally, the control treatment where the lowest height was observed with 140.74 cm, as shown in Table 4 below. These results can be attributed to the characteristics of these crops used as GM to produce high amounts of biomass and supply nitrogen to subsequent crops. GM and nitrogen fertilization in top dressing on corn crops positively influenced plant height, even without nitrogen fertilization (Salahin et al., 2013).
Table 2.
Average values for plant height.
The green manures to the corn stalk diameter
The results of the average diameter of the plants found that their response was similar to that recorded in the height of the plants. Thus, it was observed that there was a statistically significant difference between the treatments studied. The largest diameter was obtained in the treatment with V. unguiculata, obtaining (3.350 cm), and the smallest diameter was obtained in the control treatment with (2.650 cm) verified at 72 Day, as shown in Table 3 below. The results found in this study differed from those obtained in another similar test, where the diameter of the plants was not influenced by the GM (Rahman et al., 2013). However, this is probably due to the slow absorption of nutrients available in the soil due to the lack of water when there were water supply problems at the test site. Water is fundamental in absorbing nutrients from the soil for plants to ensure the growth and development of plants in the vegetative phase (Ambrosano et al., 2013).
Table 3.
Average values referring to stem diameter.
The green manures to the corn leaf area
Regarding the leaf area, the averages of the treatments showed a significant difference between the treatments from day 30 to 44, and corn presented a greater leaf area in the treatment constituted by P. lunatus reaching a maximum of (302.90 cm2), from day 51 to 72. There were higher averages of leaf area in treatments consisting of V. unguiculata, reaching (612.41). The lowest averages were verified in the control treatment from day 30 to 72. The treatment with P. lunatus may have stood out in the first 30 to 44 days because it presents more phosphorus than the other treatments, as shown in Table 4 below. Phosphorus is crucial in plant metabolism. Its limitations at the beginning of the vegetative cycle can result in restrictions in development, from which the plant does not recover later, even increasing to adequate levels (Mandal et al., 2003).
These results were similar to other research, which evaluated the development of the corn crop after the use of organic fertilizers provided by the use of GM, with a test consisting of four types of different legumes and a control treatment, with significant differences for the variable, leaf area, and control treatment (Cavigelli and Thien, 2003).
Table 4.
Average values referring to leaf area.
The green manures to the corn leaf area index
The statistically significant difference between the treatments was observed that the V.unguiculata presented a maximum IAF of (0.255 cm2/cm2) followed by the treatment with black M. aterrima with (0.254 cm2/cm2) and the lowest IAF was observed in the control treatment obtaining 0.169, as shown in Table 5 below. The genetic characteristics of the culture used can explain this fact. These results are similar to the results found in other research, aiming to verify the performance of the corn crop under direct planting, with and without application of N in coverage, in succession to summer GM, concluded that GM influenced the leaf area index (Sans and Santana, 2002).
Table 5.
Average values referring to the leaf area index.
The green manures to the corn productivity
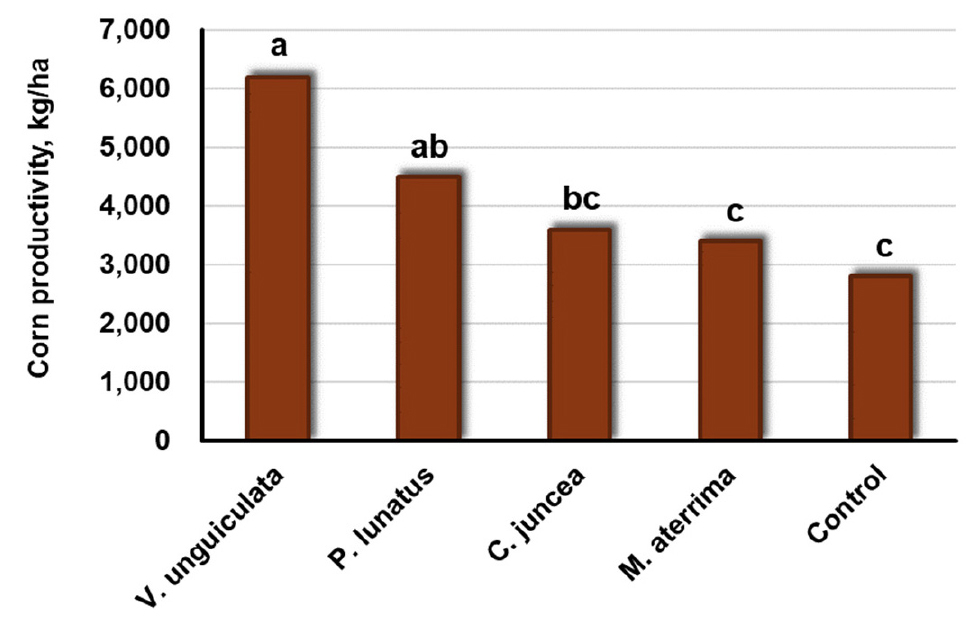
The yields of corn grain produced through GM with M.Aterrima, V.unguiculata, P.lunatus and C. juncea was 2 to 5 times higher than corn cultivation without the use of GM, with a variation between 2.843 kg ha-1 (without GM) and 6.751 kg ha-1 (use GM), as shown in Fig. 6 below. In general, the results demonstrated that using GM as a management strategy for conserving soil quality can be considered a promising practice in the production unit in areas with low input application.
Productivity in the area of soil fertilized with V. unguiculata and M. aterrima contributed most to the increases in corn productivity, when compared to the production system with other legume varieties.
Conclusion
Green manure (GM) represents a sustainable tool for improving soil fertility in agricultural production. GM positively impacts various aspects of crop performance, including yield, growth metrics, and soil management practices, particularly in terms of enhancing soil structure and nutrient availability. The GM-based farming system can be an alternative to current and traditional agricultural production approaches. Four legumes as GM, M. aterrima, P. lunatus, C. juncea, and V. unguiculata, were considered effective for green manure in producing dry matter, organic matter, and contribution of nitrogen and potassium. The application of GM improved the soil’s physical, chemical, and biological conditions, increasing the amount of organic matter. According to soil chemical analyses carried out, it was proven that there were significant increases in nutrients in the chemical variables (Na, K, N, C, OM, P, and C/N) of the soil; nutrient levels were higher in soils cultivated with legumes V. unguiculata and M. aterrima. The corn crop used as control responded significantly to GM application for all growth and development periods of the plant (plant height, stem diameter, leaf area, and leaf area index). In particular, the results showed that V. unguiculata had the greatest effect on improving soil properties and corn yield. However, because there is a significant difference in the growth level of legumes grown for GM, it is necessary to analyze the dry weight effect. According to this, corn plant height (2.8 times), stem diameter (2.5 times), leaf area (2.6 times), leaf area index (2.6 times), and productivity (2 times) were all approximately 2~3 times effective for P. luatus than for V. unguiculata. Although legume crops are effective as GM, it can be said that there is differentiation in the GM effect depending on the legume species.
