

Introduction
Materials and Methods
Power transmission system of the cabbage transplanter
Determination of appropriate number of gearbox stages
Calculating the load capacity of gears
Tooth bending stress
Tooth contact stress
Transmission error in gear systems
Gear sizing optimization
Efficiency and power loss calculations of the gearbox
Efficiency computation methods
Results and discussion
Effect of face width on gear stresses and safety factors
Transmission error results for multi-stage gear train
Multi-stage gear-sizing optimization results and insights
Gearbox efficiency and power loss analysis
Conclusions
Introduction
Cabbage (Brassica rapa subsp. pekinensis) cultivation, being one of the most widely grown vegetables globally, requires precise transplanting operations to ensure optimal plant spacing, root protection, and establishment success (Fang et al., 2004). Traditional manual transplanting methods, while effective, are labor-intensive and time-consuming, making mechanized solutions increasingly attractive to modern farmers (Islam, 2020). The introduction of semi-automatic biodegradable potted cabbage transplanters addresses these challenges by combining operational efficiency with environmental sustainability.
The power transmission system is central to transplanting machinery, providing the essential link between the prime mover and operational components (Raikwar et al., 2015). Within this system, the gearbox is the key determinant of performance, reliability, and efficiency (Salomon et al., 2016), yet the design optimization for lightweight, durable agricultural transplanters remains insufficiently addressed. For a 2-kW semi-automatic system, the gearbox must efficiently distribute power among multiple functions including pot feeding, soil penetration, plant placement, and machine propulsion while maintaining precise timing and coordination (Wang and Zeng, 2025). The significance of gearbox optimization in agricultural machinery extends beyond mere power transmission. Modern transplanters require variable speed operations, precise torque control, and adaptability to different soil conditions and crop requirements (Cheng et al., 2022). Gearbox design directly influences fuel consumption, operational costs, maintenance requirements, and overall machine longevity (Kim et al., 2020). Furthermore, in the context of biodegradable pot handling, the transmission system must provide gentle yet secure handling mechanisms to prevent pot damage while ensuring accurate placement (Briassoulis, 2004).
The gearbox in transplanters performs essential functions. The gearbox reduces engine speed to levels suitable for transplanting operations (Yang et al., 2020), multiplies torque to overcome soil resistance and enable pot insertion (Zhao et al., 2019), and distributes power to subsystems such as planting mechanisms, conveyors, and auxiliaries (Koten and Tanamal, 2017). It also ensures synchronized operation of these subsystems to maintain uniform planting patterns and spacing (Pérez-Ruiz and Slaughter, 2021). These functionalities highlight the critical importance of gearbox optimization in achieving efficiency and reliability in agricultural machinery.
Optimized gearbox contributes to improved fuel efficiency, reduced emissions, enhanced operational reliability, and lower maintenance costs (He et al., 2019). In the context of sustainable agriculture, these benefits align with broader environmental goals while providing economic advantages to farmers. Moreover, optimized gearboxes enable better adaptation to varying field conditions, crop requirements, and operational preferences, thereby increasing the versatility and market appeal of agricultural machinery (Vlăduț and Ungureanu, 2024).
Conventional gearbox designs exhibit significant limitations when applied to transplanting operations. Most are based on the assumption of constant loads, whereas transplanting machinery operates under highly variable conditions influenced by soil type, pot material, and working speed (Sun et al., 2016). Such variations often result in inefficiencies, accelerated wear, and reduced component lifespan. Moreover, existing designs inadequately accommodate the requirements of biodegradable pots, which demand gentler handling and precise force control to avoid damage (Ali et al., 2025). Failure to address these needs contributes to elevated pot breakage rates and diminished transplanting success (Habineza et al., 2023).
To overcome these shortcomings, geometric optimization has become essential in gearbox design. Conventional approaches relying on empirical rules often result in over- or under-designed systems that fail to meet modern agricultural demands, particularly for biodegradable potted transplanting. Critical parameters including gear tooth profile, pressure angle, helix angle, face width, and center distance directly influence performance, efficiency, noise, and durability (Khayyam et al., 2019). A systematic optimization process, integrated with transmission analysis, enables evaluation of torque distribution, efficiency losses, dynamic responses, and potential failure modes under variable operating conditions (Pezzini et al., 2011).
The present study focuses on gearbox analysis under constant load assumptions, which remain standard in many design practices. While variable loads are important for realistic transplanting conditions, their inclusion is left for future research. Careful geometry selection reduces mesh noise and vibration, improving operator comfort and compliance with noise regulations, while enhanced load distribution, lubrication, and stress minimization extend component life and reliability in harsh agricultural environments. Although this approach demands greater design effort and computational resources, the long-term benefits—including reduced fuel consumption, lower maintenance costs, and improved productivity make it indispensable for modern gearbox development. In this context, the objective of this study was to develop and optimize a compact three-stage gearbox for a 2-kW semi-automatic biodegradable potted cabbage transplanter by integrating geometric optimization, transmission performance evaluation and 3D modeling and simulation.
Materials and Methods
Power transmission system of the cabbage transplanter
The overall structure and power transmission system of the semi-automatic cabbage transplanter under development are illustrated in Fig. 1. The system includes a single-row transplanting unit specifically designed for biodegradable pot cabbage seedlings. A conveying unit is mounted on the transplanting unit to transfer seedlings into the planting hopper, which subsequently places them into the soil (Fig. 1(C)). Similar to other vegetable transplanters (Ali et al., 2024), the prototype comprises three primary mechanisms: an extraction mechanism for seedling selection, a conveyor mechanism for transfer, and a planting mechanism for soil placement. In operation, seedlings are manually removed from the tray and sequentially transferred from the conveying hopper to the planting hopper for transplantation.
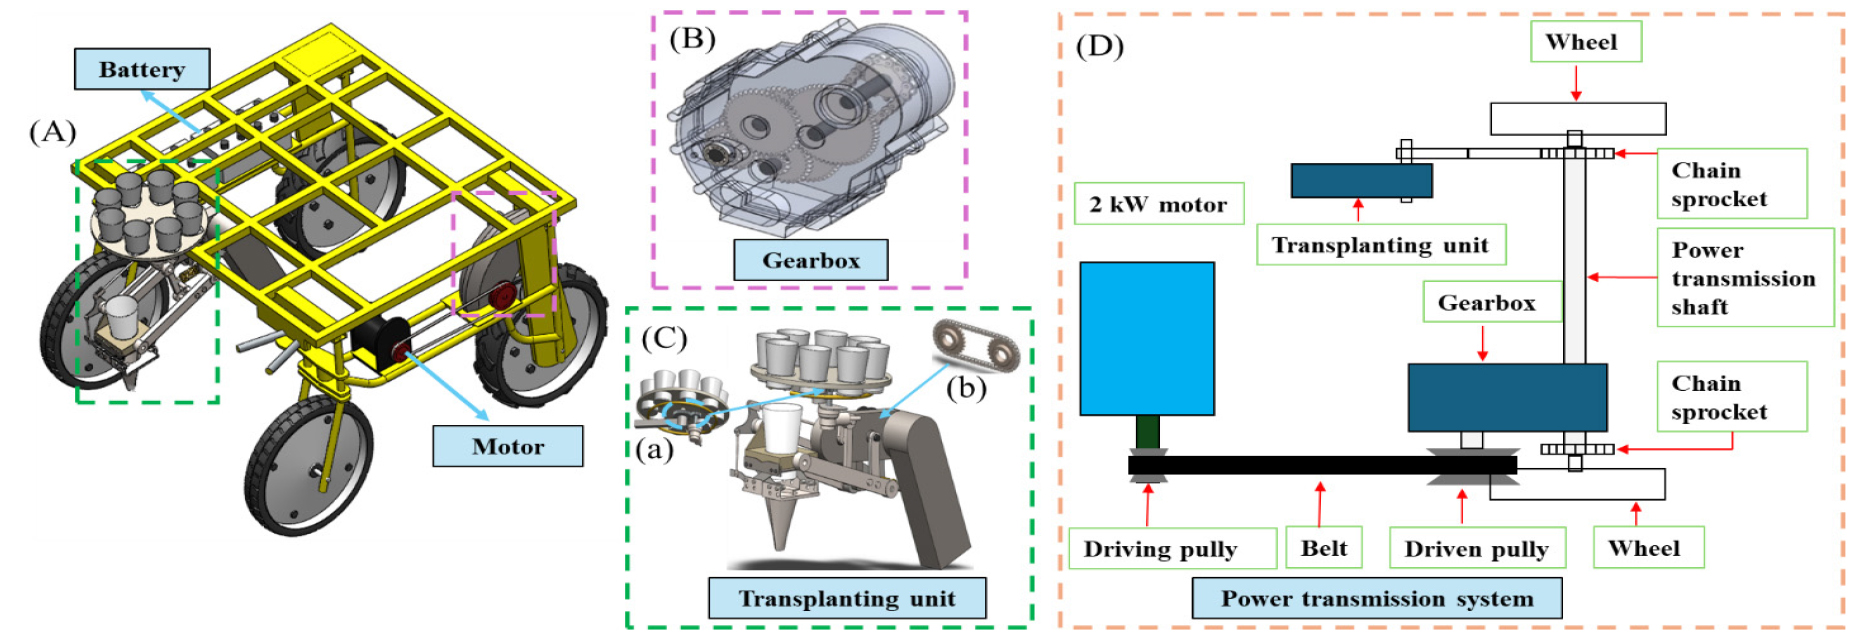
Fig. 1.
Schematic representation of the cabbage transplanter under development: (A) semi-automatic cabbage transplanter, (B) main gearbox for power distribution, (C) transplanting unit composed of (a) chain and sprocket drive system and (b) spur gear for conveyor motion, and (D) power transmission system.
A 2-kW three-phase electric motor (Jungwoo Electric Co. Ltd., Gimpo, Republic of Korea) was selected as the power source for the transplanter, with specifications summarized in Table 1. Power was transmitted to the gearbox through a belt–pulley system (1:1 ratio, center distance 400 mm). From the gearbox output shaft, the power was divided into two drivelines: one driving the wheels, and the other operating the transplanting mechanisms. The transplanter prototype was equipped with two rear wheels (diameter 460 mm) and two front wheels (diameter 430 mm) to ensure field mobility. A multi-stage reduction gearbox transmitted and adjusted motor power to the working components using a chain and sprocket drive system.
Table 1.
Technical descriptions of the motor used in this study.
| Item | Description |
| Motor type | Induction motor |
| Model number | JDG00667 |
| Phase | 3-phase |
| Voltage | 230 V |
| Current | 5.35 A |
| Frequency | 120 Hz |
| Efficiency | 82.5% max. |
| Speed | 3,480 rpm max. |
Determination of appropriate number of gearbox stages
In designing a multi-stage transmission system for a specified overall ratio, a key consideration is determining the appropriate number of stages and distributing the gear ratio across them. Gear dimensions were initially selected based on predefined design parameters, with the minimum allowable gearbox size set at 300 mm. Subsequent simulations incorporating different material configurations were performed to estimate transmission power losses. The variables considered in the transmission analysis for the cabbage transplanter are summarized in Table 2.
Table 2.
Definition and units of variables applied in transmission efficiency and power loss analysis.
Gear train efficiency plays a critical role in determining the number of stages within a gearbox, particularly when power consumption and output torque are of primary concern. This study investigated the feasible range of transmission ratios for each gear train stage. To determine a suitable configuration, the overall transmission ratio required was calculated based on the motor input speed (720 rpm) and the transplanting mechanism speed (60 rpm), yielding a value of approximately 12:1. Within this configuration, the gear ratio of the final stage gear pair was set at 3.47:1, while the preceding stages of the gearbox and chain–sprocket drive system provided the remaining reduction. This clarified design ensured that the final transplanting speed requirement was achieved. The efficiency of each gear stage was first calculated to estimate the total transmission efficiency and identify the optimal range for the number of teeth in the final gear pair. The target minimum efficiency was set at 98.0 percent, in accordance with the benchmark reported by Xu et al. in (2007).
The efficiency of a single stage spur gear train, denoted as , was computed using the analytical method proposed by Velex and Ville in (2009), as detailed in Eqs. (1, 2, 3) as below. The essential parameters and design assumptions used in the determination of an appropriate multistage gearbox configuration for the transplanter are summarized in Table 3.
Table 3.
Primary parameter consideration to determine a multi-stage gearbox for cabbage transplanter power transmission from motor to other components.
| Parameter | Specification |
| Input speed | 720 rpm |
| Output speed | 60 rpm |
| Input torque | 5.49 Nm |
| Output torque | 65.88 Nm |
| Overall transmission ratio | 12:1 |
| Final gear ratio | 3.47:1 |
| Gearbox available length | 300 mm |
The overall transmission ratio of the system was determined to be 12:1, based on the motor input speed of 720 rpm and the transplanting mechanism requirement of 60 rpm. Within this multi-stage gearbox, the ratio of the final gear pair was set at 3.47:1, with the remaining reduction achieved through preceding gearbox stages and the chain sprocket drive system. This design ensured both the required transplanting speed and torque were attained.
Calculating the load capacity of gears
Spur gears are widely used in power transmission systems for smooth and quiet operation. The teeth transmit torque but also generate stresses that affect durability. The main concerns are tooth bending stress and contact stress, which can lead to fatigue, pitting, or wear if not properly addressed (Shigley et al., 2004; Radzevich and Dudley, 1994). To evaluate load capacity, designers rely on standards such as AGMA 2001-D04 (1994) and ISO 6336 (2006), which consider geometry, material, lubrication, hardness, and dynamic effects. Finite Element Analysis (FEA) further enhances stress evaluation, ensuring gear strength, durability, and reliability in applications from automotive to heavy machinery.
Tooth bending stress
The action of the transmitted tangential load induces bending stresses within the gear tooth, whereas the radial component contributes primarily to compressive stresses along the tooth profile. These combined loading conditions result in stress concentrations near the tooth root, which represent the most critical region for fatigue failure. Consequently, a proper assessment of load-carrying capacity requires the inclusion of these localized stress effects in the design procedure. A schematic representation of the force components acting on a gear tooth is provided in Fig. 2, while the corresponding formulation for evaluating the tooth root bending stress, as prescribed by the ISO 6336 (ISO, 2006).
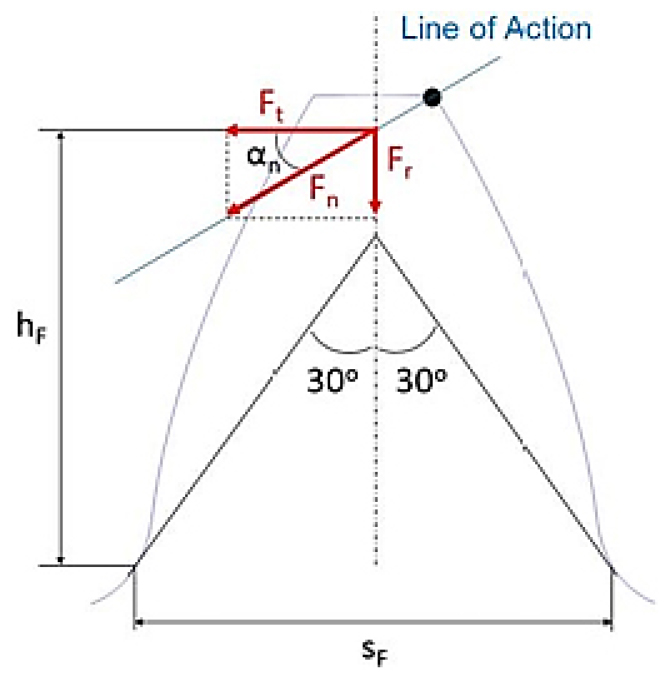
The root stress (σF) is expressed mathematically using Eq. (4) as follows (Can et al., 2023):
Where, Ft represents the nominal tangential load (N), b is the face width (mm), mn denotes the normal module (mm), YF is the tooth form factor, Ys is the stress correction factor , Yɛ is the contact ratio factor, and Yβ is the helix angle factor. In addition, KA is the application factor, KV is the dynamic factor, KFβ is the face load distribution factor, and KFα the transverse load distribution factor. The allowable bending stress (σFP) is then determined according to the following relation as shown in Eq. (5):
Where, σF lim. denotes the nominal stress (N/mm2), YST is the stress correction factor, YN is the life factor, Yδ is the relative notch sensitivity factor, YR represents the relative surface factor, and YX corresponds to the size factor. Based on these parameters, the safety factor against bending stress (SF), is evaluated using the following expression as Eq. (6):
Tooth contact stress
During power transmission, the interaction of forces at the meshing surfaces of the gear pair generates a localized surface pressure, commonly referred to as Hertzian contact stress, as illustrated in Fig. 3. This phenomenon arises because the load is distributed over a relatively small contact area. Such stresses can lead to surface wear and pitting, primarily as a result of material fatigue. In accordance with the ISO 6336 standard, the surface pressure acting on gears is determined using the following relation (ISO, 1996):
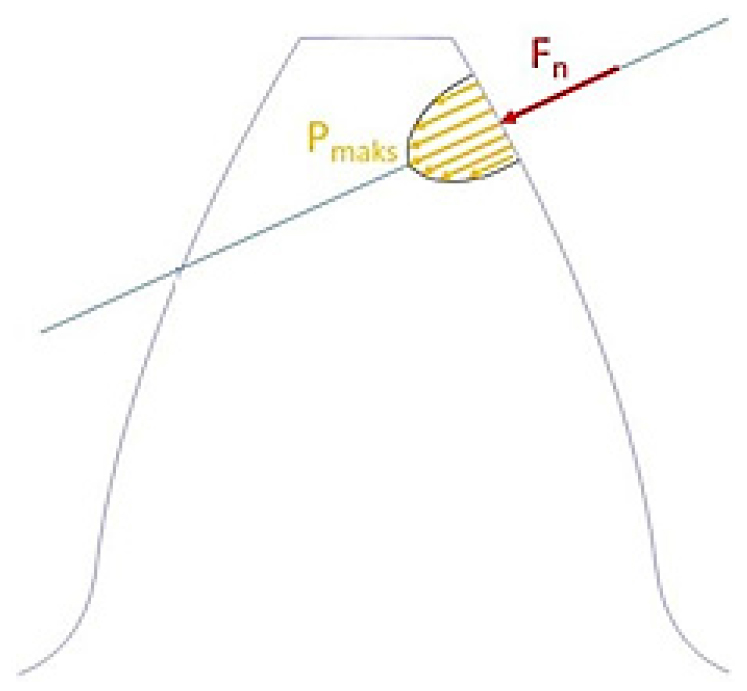
The effective contact stress (σH) can be determined as Eq. (7) as below (Can et al., 2024):
Where, u denotes the gear ratio, ZH is the zone factor, ZE represents the elasticity factor, Zɛ is the contact ratio factor, and Zβ corresponds to the helix angle factor. In addition, KHβ is the face load distribution factor, while KHα is the transverse load distribution factor. The allowable contact stress (σHP) is then determined according to the Eq. (8) as follows:
Where, σH lim represents the allowable contact stress (N/mm2), ZN is the life factor, ZL is the lubrication factor, ZV is the velocity factor, ZR is the surface roughness factor, ZW is the work-hardening factor, and ZX is the size factor.
On this basis, the safety factor for contact stress (SH) can be evaluated using the following Eq. (9):
Numerical values for all factors in Eqs. (4), (5), (6), (7), (8), (9) were established in accordance with ISO 6336 and relevant literature, considering the operating conditions of the transplanter (moderate field shocks, adequate lubrication, steel-steel spur gear mesh). The adopted values are summarized in Table 4. Geometry-dependent coefficients (e.g., YF,YS,Yε,ZH,Zε) were obtained from ISO charts using the selected gear dimensions and measured contact ratio, while operating factors (e.g., KA,KV) reflect the duty cycle and pitch-line velocity.
Table 4.
Key parameter values used in gear stress and safety-factor calculations.
Transmission error in gear systems
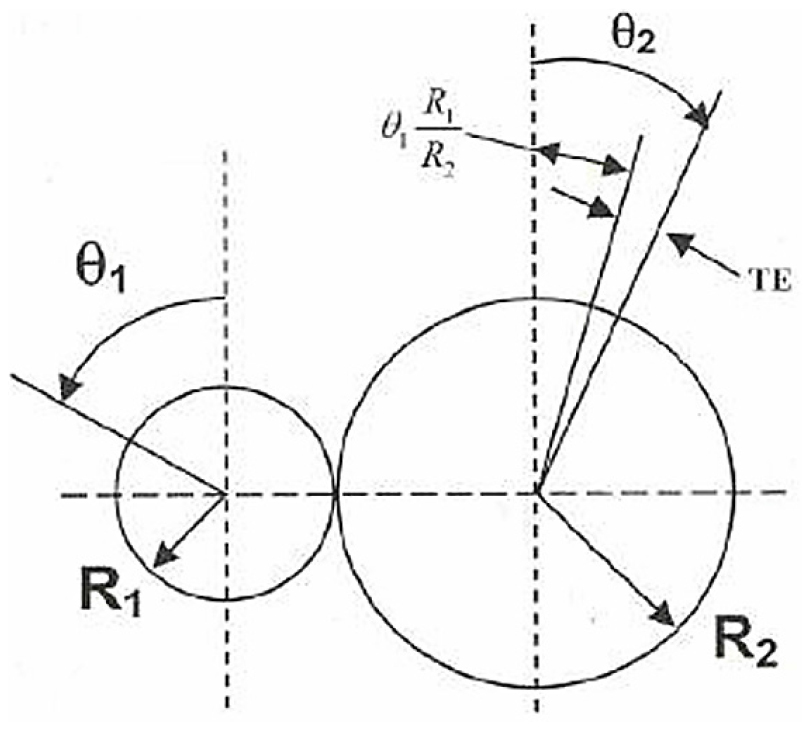
As shown in Fig. 4, transmission error (TE) is a key parameter in tooth contact analysis because of its strong influence on gearbox noise and vibration. Ideally, an involute tooth profile ensures uniform angular motion, but in practice, deviations occur, defined as TE. This deviation generates torsional accelerations that excite bearings and the gearbox housing, producing airborne noise (Tharmakulasingam, 2010; Wright, 2009). TE can be classified as manufacturing, kinematic, static, or dynamic; this study focuses on static TE (STE), measured at low speed to minimize dynamic effects. STE depends on mesh stiffness, load, profile errors, and alignment, and can be reduced by geometry modifications such as tip relief. Prior studies using analytical, FEM, and hybrid methods confirm that optimizing geometry improves stiffness and reduces TE (Shweiki et al., 2019; Bruyère et al., 2015; Bozca, 2018). Wright (2009) also formalized its mathematical representation, shown in Eq. (10).
In this formulation, θ1 refers to the angular displacement of the pinion, while θ2 denotes the angular displacement of the gear. The parameters N1 and N2 correspond to the total number of teeth on the pinion and the gear, respectively.
Gear sizing optimization
Gear sizing is critical in mechanical power transmission, influencing load capacity, efficiency, durability, and cost. Proper selection of parameters such as module, face width, pressure angle, and helix angle prevent failures from bending fatigue or surface pitting. Standards like ISO 6336 and AGMA 2001-D04 guide stress evaluation and safety factors, while optimization-based methods balance strength, weight, and manufacturability. In this study, fine sizing was performed using gear design software to optimize geometry and load capacity in compliance with ISO 6336. The workflow began with selecting face width, quality level, and module, then refining center distance, tooth numbers, and helix angle. Software outputs included torque capacity, contact and bending stresses, overlap ratio, and gear weight.
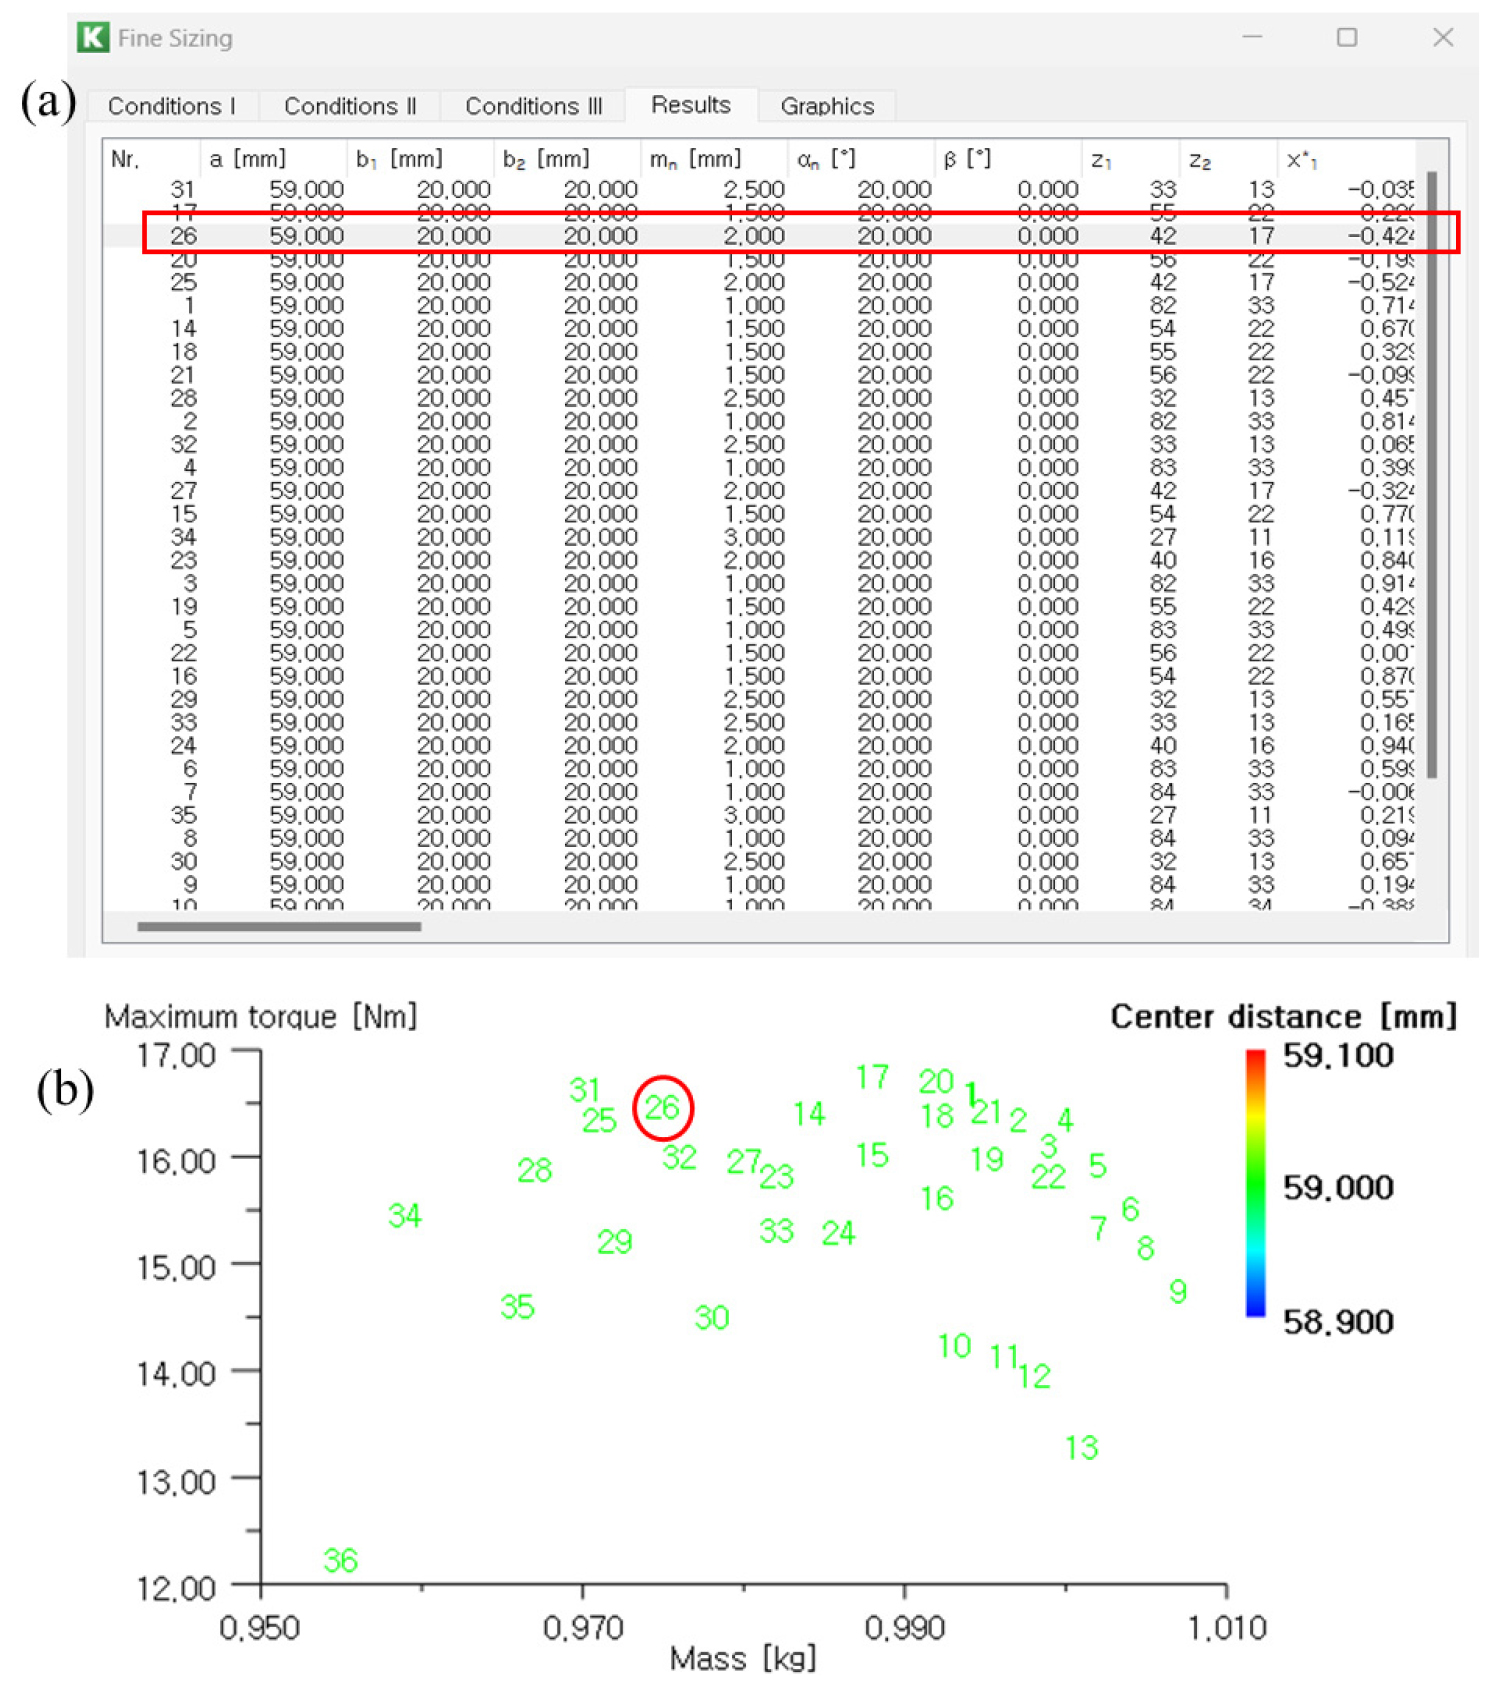
For the first-stage gear pair, the design was conducted under the conditions of a transmitted torque of 5.49 Nm, a gear ratio of 2.5, a pressure angle of 20°, and a module range between 1 to 5 mm. Based on these input parameters, the software generated 386 feasible solutions, each corresponding to a unique combination of gear geometry and load-bearing characteristics (Fig. 5). These solutions varied with respect to tooth numbers, module sizes, face widths, and center distances. From this solution space, further optimization was performed to identify gear sets that fulfilled both the strength requirements (tooth root bending stress, Hertzian contact stress, and corresponding safety factors) and the geometric constraints of the system.
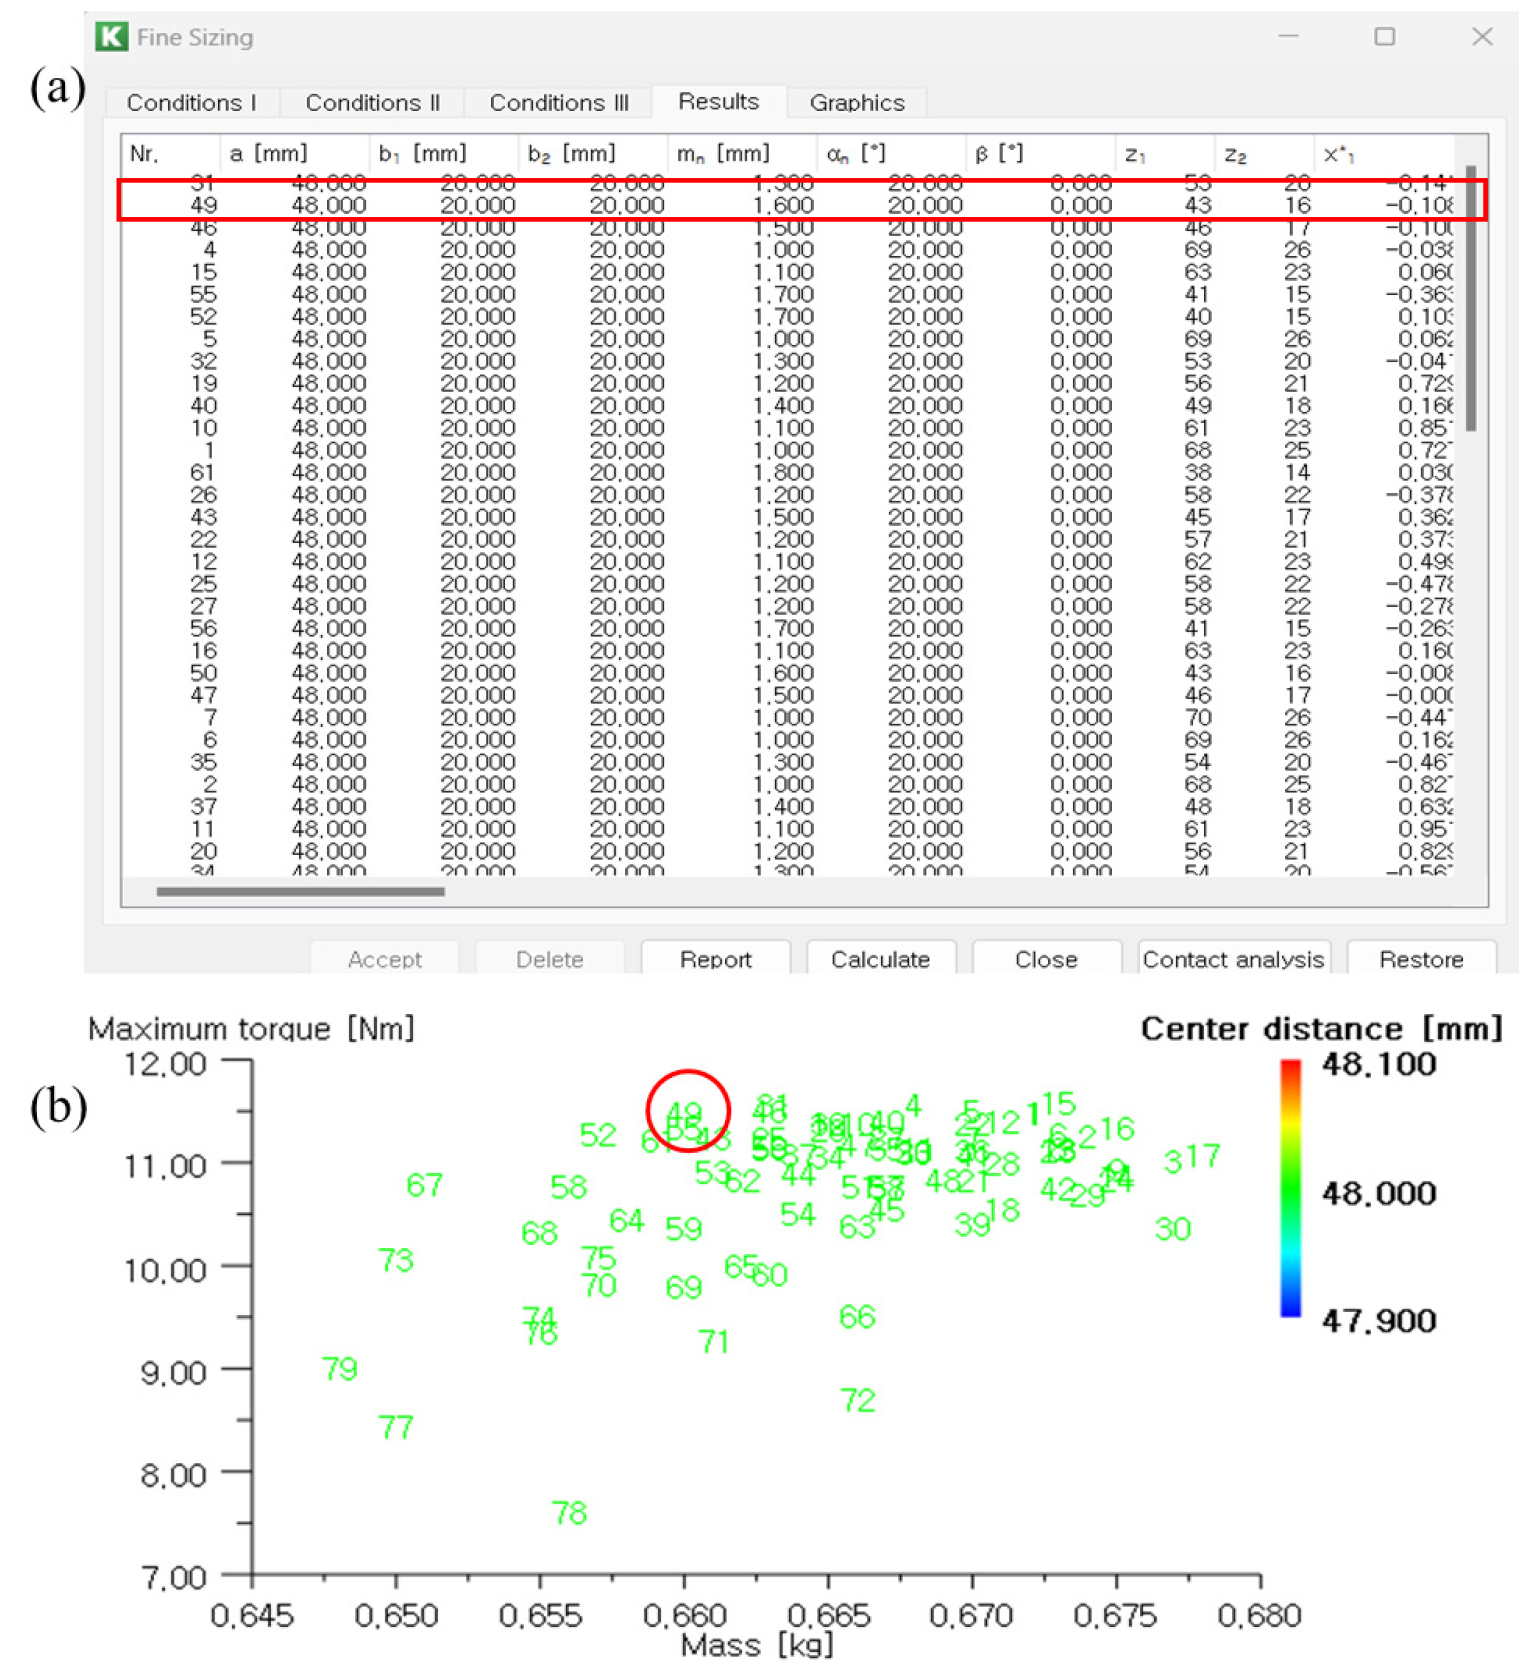
The second-stage gear pairs were analyzed under the conditions of a gear ratio of 2.68, a pressure angle of 20°, and a module range between 1 mm and 5 mm. The transmitted torque was applied as specified for the stage, and the design space was explored systematically in compliance with ISO 6336 standards. According to the results, a total of 278 feasible solutions were obtained, each corresponding to different combinations of gear geometry and performance parameters. These solutions as shown in Fig. 6, varied with respect to module size, number of teeth, face width, and center distance. From this solution space, further optimization was performed to identify the gear set that offered the best balance between load-carrying capacity, compactness, and mass efficiency.
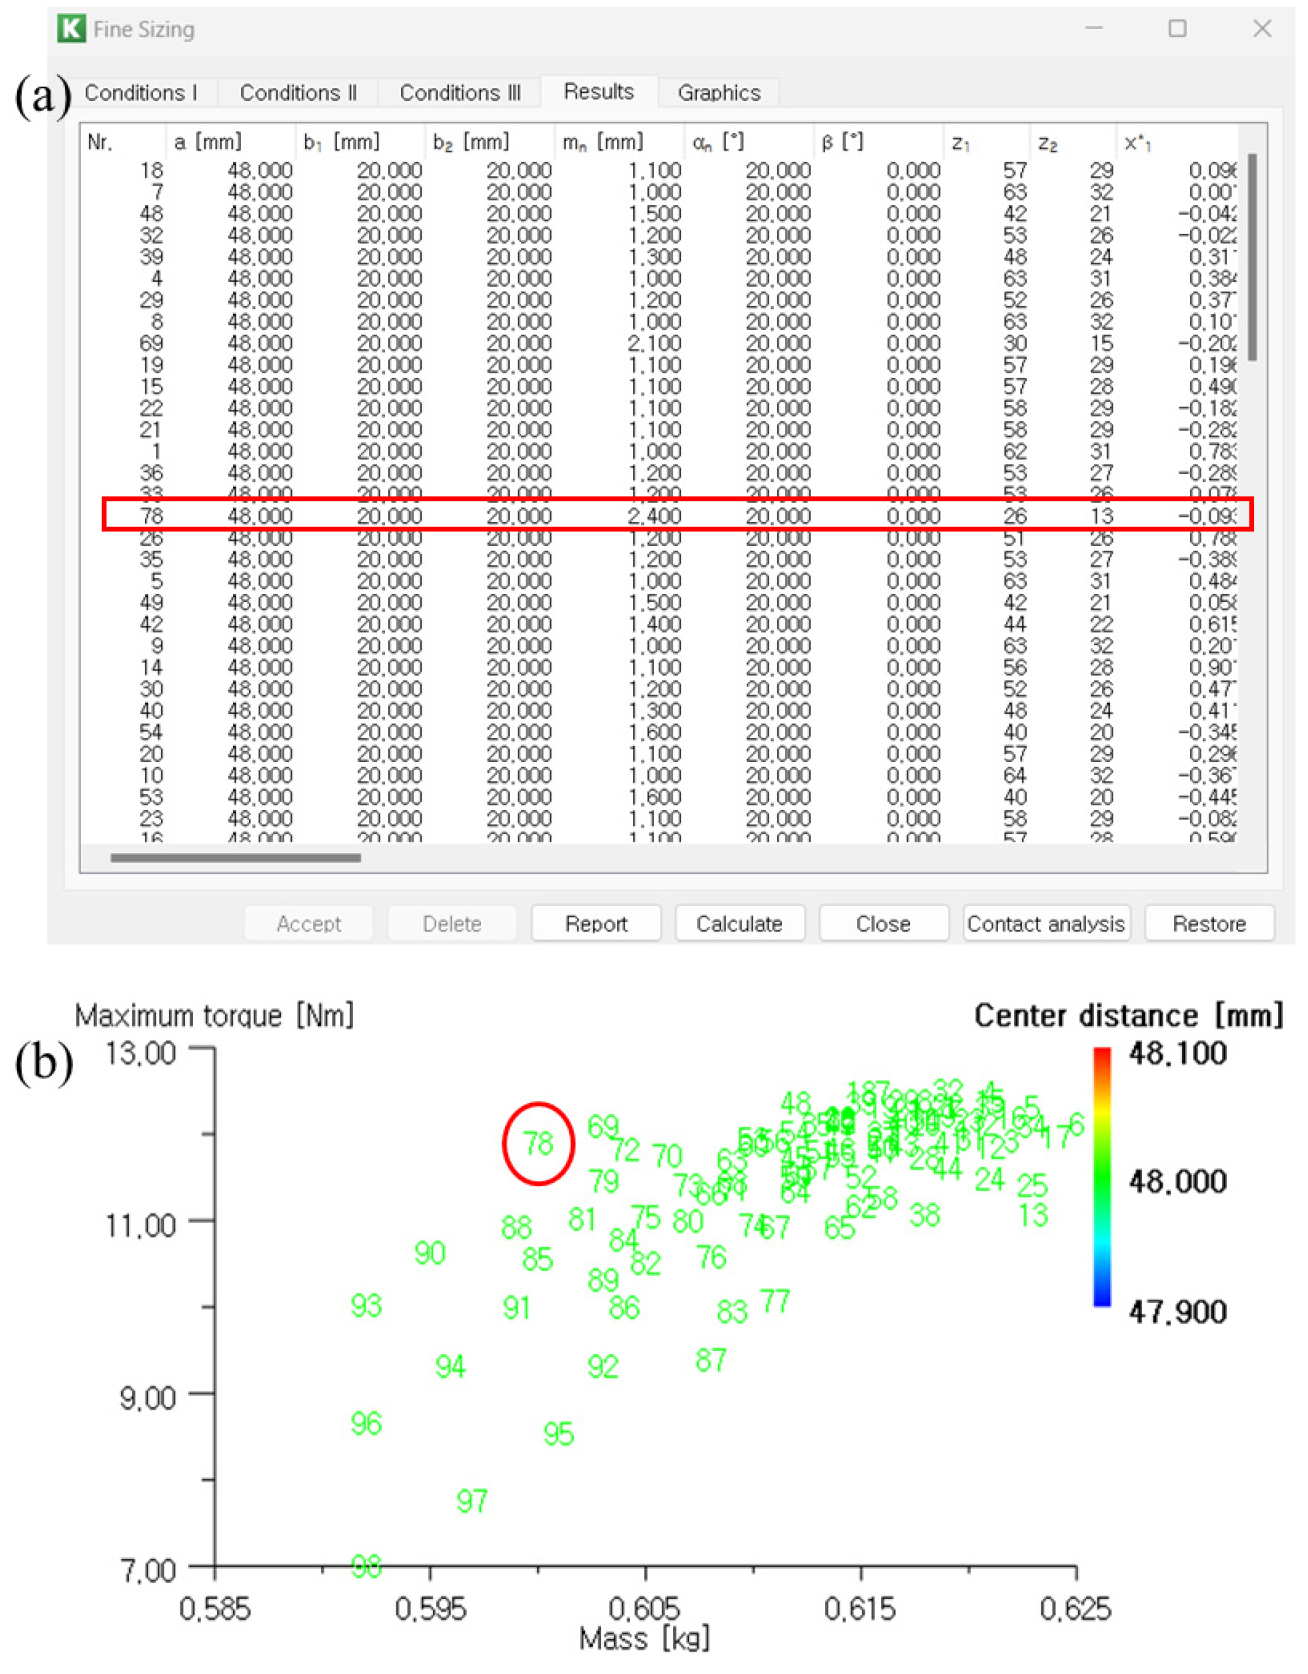
The third-stage gear pairs were designed and optimized for a gear ratio of 2.0, a pressure angle of 20°, and a module range between 1 mm and 5 mm, in accordance with the recommendations of ISO 6336. The analysis produced a total of 418 feasible solutions, each representing different combinations of geometric and performance parameters, including tooth numbers, module size, face width, and center distance. These candidate solutions shown in Fig. 7, were subsequently evaluated to identify the optimal balance between load-carrying capacity, gear compactness, and mass reduction.
Efficiency and power loss calculations of the gearbox
Power loss in the gearbox
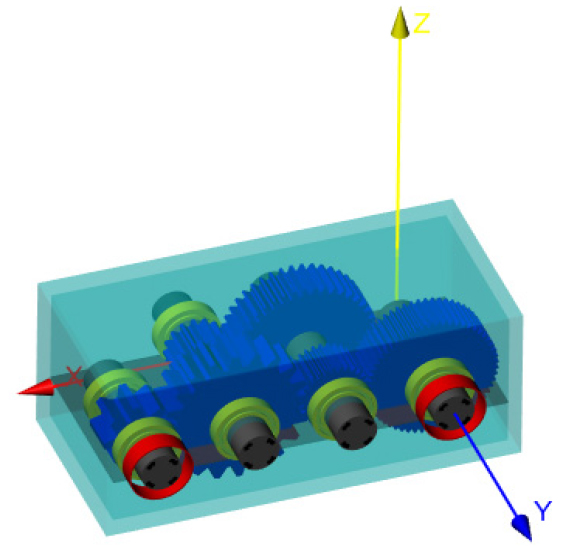
The gearbox of the cabbage transplanter was analyzed using three-dimensional simulation software (KISSsoft, Version 2018, KISSsoft AG, Bubikon, Switzerland). Fig. 8 presents the simulation model with an input torque of 5.49 Nm and a rotational speed of 720 rpm applied to the first-stage reducer. Gearbox geometry and materials were defined, with spur gears modeled in steel using 25CrMo4 medium carbon steel and C60 high carbon steel, commonly used in research and industry (Islam et al., 2022; Choi and Choi, 1999). For lubricant evaluation, thermal conductivity was set to 50 W/(m·K) at an oil temperature of 80°C.
Accuracy and power loss were assessed using the ISO TR 14179-2 environment, with a housing wall thickness of 5 mm for heat dissipation. The total gearbox volume was 49.80 mm3, including gears, shafts, and lubricant filling. Efficiency was influenced by operational losses: windage, lubricant churning, sliding, and rolling friction. Windage occurs when lubricants are expelled during meshing (Handschuh and Kilmain, 2008), while churning arises from gear movement in oil, increasing with submersion (Townsend et al., 1978). Gear motion combines rolling and sliding. Sliding losses depend on velocity and frictional force, while rolling losses are influenced by velocity and lubricant film thickness. Sliding velocity peaks along the contact path (Kuria and Kihiu, 2011), and lubricant entrainment sustains film formation, reducing surface interaction (Heingartner and Mba, 2003). The gearbox parameters summarized in Table 5 were used for the power transmission simulation.
Table 5.
Gearbox parameters are considered in the power transmission simulation.
The analytical model decomposes power losses into their fundamental physical mechanisms. Gear losses are attributed to four major friction sources: sliding friction, rolling friction, oil churning, and windage (Velex and Ville, 2009; Hammami, 2017). Bearing losses are computed using the SKF method, widely applied in tribological practice. Additional losses arising from clutches, synchronizers, actuators, and oil pumps are estimated using the framework proposed by Hsieh and Chen (2016). However, in the present single-speed transmission, these components are not considered; thus, their contribution, along with gear sealing losses, is assumed to be negligible. The total power loss is therefore given as:
Where, Pb is the bearing loss, Pg is the gear loss, Pcl is the clutch loss, Psyn is the synchronizer loss, Pa is the actuator loss, and Pp is the oil pump loss.
Efficiency computation methods
Gear transmission efficiency depends on how power losses are distributed across the system. In this work, efficiency was evaluated following ISO/TR 14179-1/2, which extends the methodology introduced in AGMA Technical Paper 96FTM9 (Santapaola, 2022). Bearing losses are derived from catalog data based on Palmgren’s classical friction theory (Palmgren, 1959), while windage and churning losses follow Radzevich and Dudley (1994), with modifications for lubricant viscosity and immersion depth. Load-dependent gear losses are modeled from rolling and sliding friction studies and refined through large-scale industrial testing (ISO, 2001). This formulation has been validated against experimental datasets from multiple manufacturers.
In contrast, ISO/TR 14179-2 employs a thermal balance method, where the equilibrium between power loss and heat dissipation is used to estimate the oil sump temperature for a given power transmission. This approach also enables the determination of the maximum transmittable power for a specified oil temperature limit and, in the case of spray lubrication, allows calculation of the required external cooling. The method is iterative in nature and adaptable to different lubrication strategies. The efficiency under this framework is expressed as (Santapaola, 2022):
Results and discussion
Determination of gearbox stages
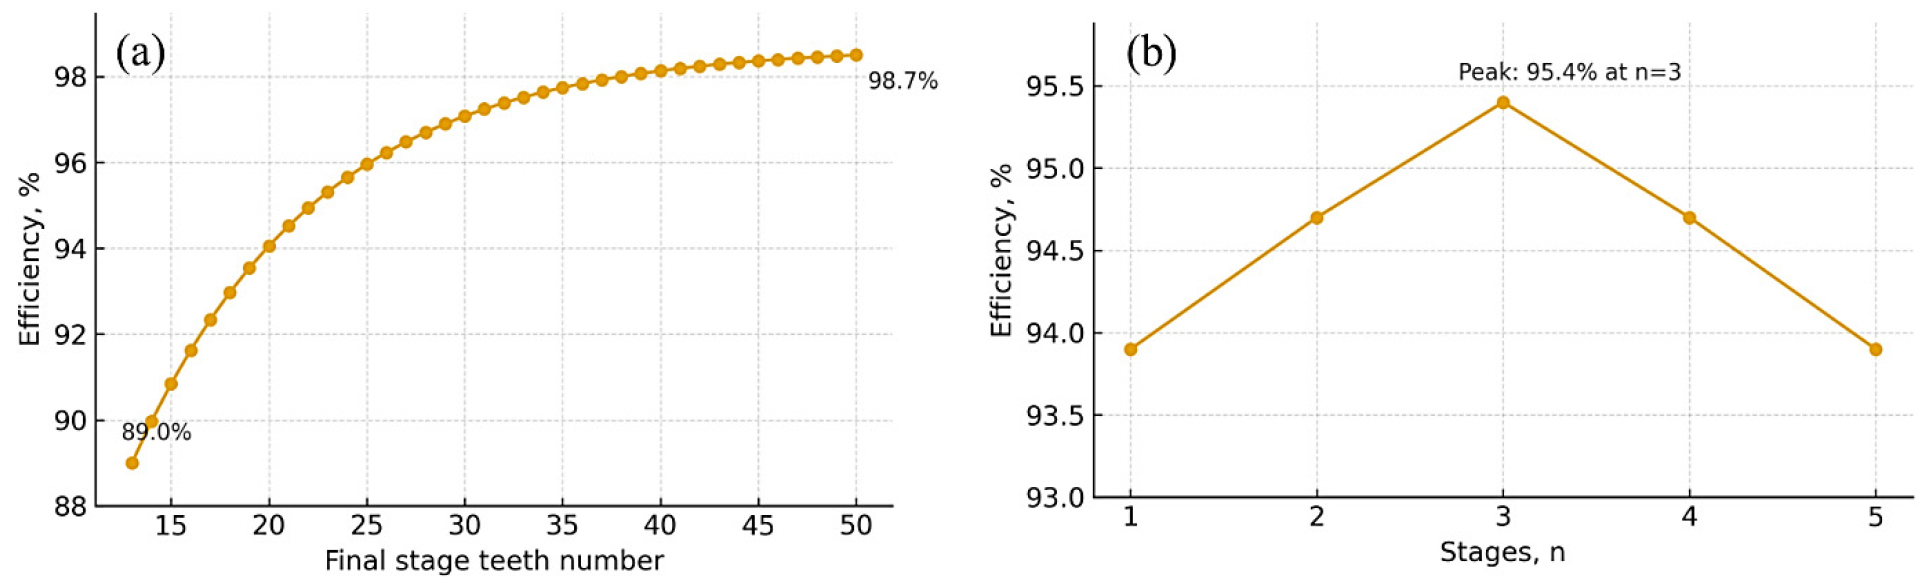
The number of teeth in the final gear stage was selected to achieve a total transmission ratio of 3.47:1. The efficiency of the complete transmission was found to lie between 88.0% and 95.4%, while the efficiency of each individual stage varied from 89.0% to 98.7%. This range indicates that gear teeth numbers between 13 and 50 can sustain efficiencies within the interval of 89.0–98.7%. Fig. 9(a) shows the number of teeth of the final stage for the total gear train efficiency.
For the target total ratio of 3.47:1, stage ratios were calculated with respect to efficiency for different values of n (1 ≤ n ≤ 5). Notably, the efficiency profiles of multi-stage transmissions peaked at three stages; however, the variation in overall efficiency across the range was relatively small. Specifically, the difference in efficiency from n = 1 to n =5 was approximately 1.5%, indicating that the number of stages has only a minor effect on transmission efficiency. Specifically, the efficiencies of various transmission peaks for eight stages are shown in Fig. 9(b). To incorporate dimensional considerations, a length objective function was formulated that accounted for both gear length and total gearbox length. For the cabbage transplanter, the gearbox length was fixed at 300 mm.
Effect of face width on gear stresses and safety factors
Fig. 10 illustrates the effect of face width on gear stress. Fig. 10(a) shows the influence of face width on root bending stress (), where the stress decreased from approximately 260 MPa at mm to 165 MPa at mm. The largest reduction occurred between 10 and 20 mm, after which the values plateaued, indicating diminishing returns from further increases in width. Fig. 10(b) presents the sensitivity of contact stress to tangential load and face width. The normalized contact-stress index increased with rising tangential load for all widths; however, for a given load, the stress index decreased markedly with larger widths. N, the index for mm was nearly 50% higher than for mm, demonstrating the benefit of wider faces in reducing localized Hertzian pressure.
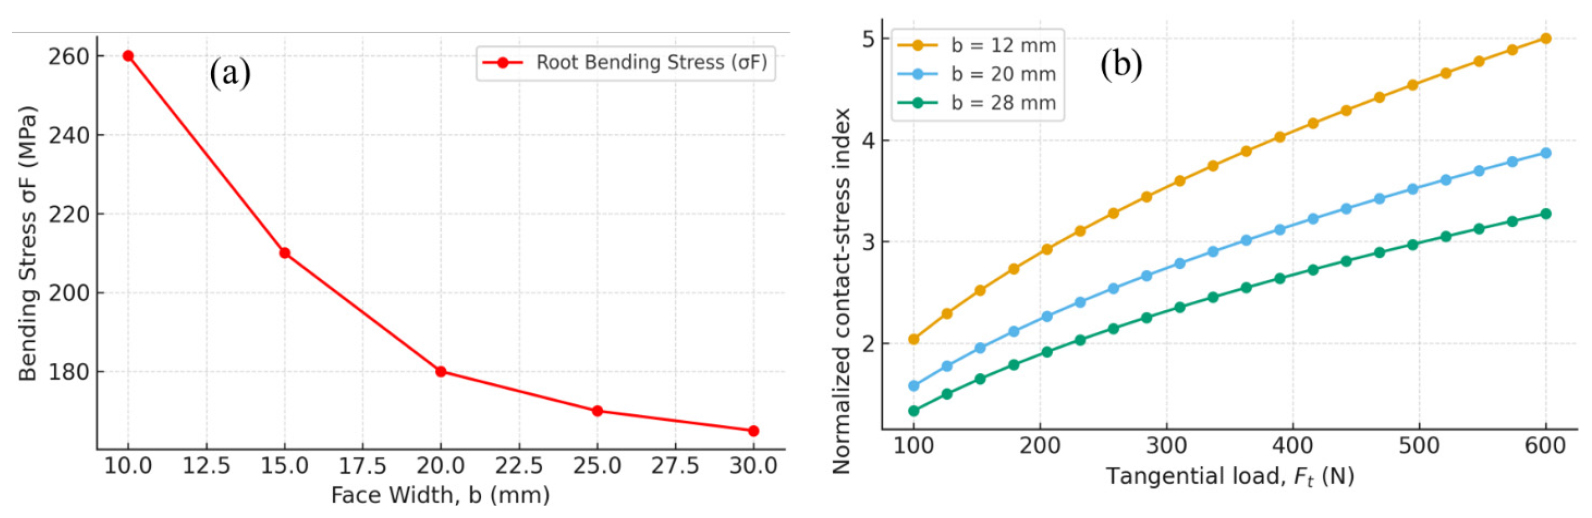
These findings confirm that both contact and root bending stresses decrease with increasing face width, consistent with ISO 6336 formulations. The observed stress range (165–260 MPa) falls within values reported for steel spur gears under moderate torque conditions. Similar nonlinear reductions have been reported in analytical and finite element studies (Khudhair, 2020; Singh and Kumar, 2020), where the most pronounced improvements occur at smaller widths. Niemann and Winter (1989) likewise noted that stress reduction tapers beyond critical width, while Radzevich and Dudley (1994) cautioned that excessive face width can increase the risk of misalignment and uneven load distribution. These results emphasize that face width should be optimized rather than maximized, ensuring durability without compromising alignment sensitivity.
Table 6 presents the safety factors for root () and flank () stresses across the three gear stages. Root safety factors are consistently higher than flank safety factors. In the first stage, root safety exceeds 9 for both gears, well above the ISO 6336 recommended minimum (SF ≥ 1.25-1.50), indicating that tooth bending strength is not a limiting factor. In the second and third stages, root safety decreases to around 5, which remains safely above the limit but reflects the higher torque carried by later stages.
By contrast, flank safety factors are lower, ranging between 2.0 and 2.9 across all gears. According to ISO 6336-2 and AGMA 2001-D04, values above 1.0 indicate sufficient durability, while values in the 2.0–3.0 range are considered acceptable for long-term operation. The comparatively lower flank safety underscores that surface durability (pitting resistance) is the governing design criterion for this gearbox, a conclusion consistent with prior reports (Radzevich and Dudley, 1994). Furthermore, the nearly constant contact ratio of ~1.54 across all stages indicates predominantly single-pair tooth contact with minimal overlap, emphasizing the importance of effective lubrication and potential profile modifications to improve load sharing and further enhance flank safety.
Table 6.
Root and flank safety factors for the three-stage gearbox.
| Stage | Gear | Root safety (SF) | Flank safety (SH) |
| 1st | Gear 1 | 10.135 | 2.526 |
| Gear 2 | 9.289 | 2.879 | |
| 2nd | Gear 1 | 5.358 | 2.012 |
| Gear 2 | 5.310 | 2.317 | |
| 3rd | Gear 1 | 5.385 | 2.012 |
| Gear 2 | 5.310 | 2.317 |
Transmission error results for multi-stage gear train
The transmission error (TE) was evaluated for all three stages of the gearbox using software, and the results are presented in Fig. 11. In the first stage (Fig. 11(a)), the TE values were relatively small, fluctuating between –2.6 μm and –1.4 μm, with a distinct localized peak observed at approximately 4° of pinion rotation. This indicates a minor stiffness variation but overall, stable mesh behavior. In the second stage (Fig. 11(b)), the magnitude of TE increased, ranging from –6.3 μm to –4.2 μm. The error curve exhibited a plateau-like region, suggesting greater variability in mesh stiffness and a higher sensitivity to applied load compared with the first stage. The third stage (Fig. 11(c)) displayed the largest TE amplitudes, varying between –10.8 μm and –7.2 μm. The broader and more uniform error profile in this stage highlights the effect of higher load transmission and increased compliance of the gear pair.
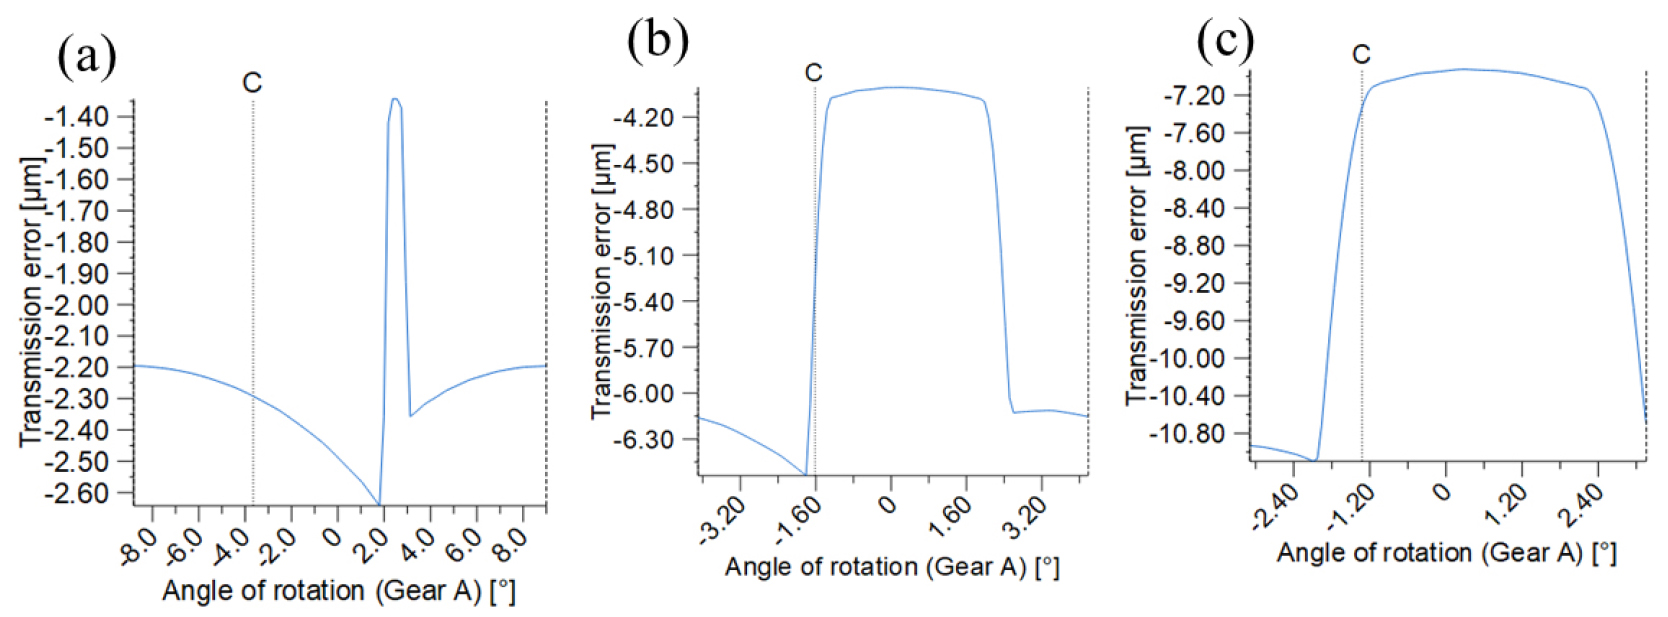
Overall, the analysis demonstrated that the magnitude of TE increased progressively from Stage 1 to Stage 3. While the absolute values remained within the typical range reported in literature for industrial spur and helical gears under quasi-static loading (2–12 μm), the third stage represented the most critical condition for error accumulation. These findings underline the necessity of considering profile modifications and alignment strategies to reduce TE, particularly in the later stages of the gearbox where the transmitted torque is higher.
In our three-stage gearbox, TE increased progressively with each stage, culminating in the largest amplitude (~10 µm) at Stage 3. This trend is in line with findings that TE magnitude typically grows with increased mesh compliance, load, and geometric imperfections in multi-stage systems (Velex and Ville, 2009). The relatively low TE observed in Stage 1 suggests that mesh stiffness and tooth geometry are sufficient for low-load conditions. By contrast, the plateau behavior in Stage 2 indicates localized stiffness fluctuations that may amplify noise through harmonic excitations. Stage 3 exhibited not only the highest TE but also the broadest distribution over the mesh involute path, reflecting increased compliance and sensitivity to load—a behavior observed in prior gear noise models (Åkerblom, 2001)
To mitigate such errors, profile modification (tip relief) is widely recognized as an effective strategy. Early work by Walker and Dudley in the 1940s established that profile relief reduces noise, friction, and wear in meshing gears (Dudley et al., 2007). More recent studies have proposed analytical and optimization methods for tip relief to minimize static TE, thereby improving drivetrain dynamic behavior (Abruzzo et al., 2023) and modifications have shown tangible reductions in dynamic excitation (Tavakoli and Houser, 1986). Overall, our measured TE values (2–11 µm) lie within the expected range for well-manufactured industrial gears under static loads (Akerblom, 2001). The data reiterate that Stage 3 warrants targeted refinement, such as optimized tip relief and alignment enhancements, to suppress TE-related noise and enhance transmission smoothness.
Multi-stage gear-sizing optimization results and insights
The fine sizing of the gearbox was carried out according to ISO 6336 procedures, with feasible solutions (Table 7) generated for each stage and subsequently refined to select the optimal configuration.
For the first stage, 386 solutions were obtained under a transmitted torque of 5.49 Nm, a gear ratio of 2.5, and a pressure angle of 20°. The optimized configuration (Solution Nr. 26) corresponded to a center distance of 59 mm, a module of 2.0 mm, a face width of 20 mm, and tooth numbers, Z1 = 42, Z2 = 17. This gear set was capable of transmitting 16–17 Nm while maintaining low system mass, indicating sufficient strength margin relative to bending and contact stress limits.
In the second stage, 278 feasible solutions were generated at a ratio of 2.68. The optimized design (Solution Nr. 49) was identified with a center distance of 48 mm, a module of 1.6 mm, a face width of 20 mm, and tooth numbers, Z1 = 43, Z2 = 16. The solution carried 12 Nm torque while reducing weight, demonstrating that optimization successfully balanced load-carrying capacity and compactness.
The third stage produced 418 feasible candidates at a ratio of 2.0. The final selection (Solution Nr. 78) corresponded to a center distance of 48 mm, a module of 2.4 mm, a face width of 20 mm, and tooth numbers, Z1 = 26, Z2 = 13. This design transmitted 12–13 Nm with favorable mass efficiency, confirming the robustness of the optimization method.
Overall, the three optimized solutions exhibited consistent safety factors above ISO 6336 minimum recommendations, ensuring resistance to both root bending fatigue and surface pitting. The results highlight the benefit of systematic optimization in exploring a wide design space and identifying gear sets that meet torque demands while minimizing weight. Previous studies have also demonstrated the effectiveness of multi-objective optimization in gear design, showing that reductions in module and center distance can yield significant mass savings without compromising durability (Yao, 2019; Cosco et al., 2022; Panda et al., 2017).
Table 7.
Optimized gear parameters and torque capacities for the three-stage gearbox.
Gearbox efficiency and power loss analysis
The gearbox simulation under a 5.49 Nm input torque and 720 rpm speed yielded a transmission efficiency of 95.4% and a total power loss of 30.1 W. Losses were distributed across rolling bearings, gears (sliding and rolling friction), and auxiliary mechanisms, as summarized in Table 8. Gear meshing accounted for the largest share of losses (5.4–13.6 W per stage), while bearing losses were relatively minor (≤0.24 W each).
The achieved efficiency (95.4%) is within the range reported for high-quality industrial spur gear transmissions (93–98%) as documented by Velex and Ville (2009), confirming the suitability of the selected gear geometry and material. The relatively low bearing losses (≤0.24 W) align with predictions based on Palmgren’s classical bearing loss model (Palmgren, 1959), while gear meshing losses dominated the total, in agreement with Radzevich and Dudley (1994).
The 30.1 W total loss is modest considering the torque and speed applied, and is consistent with ISO/TR 14179-based calculations where sliding, rolling, windage, and churning are the primary contributors (ISO/TR 14179-1/2, 2001). Previous studies also note that windage and churning losses become more significant at higher speeds and deeper oil immersion (Handschuh and Hurrell, 2011), though in this case their contribution was small due to optimized housing design and controlled lubrication.
These results validate that careful gear sizing, material selection, and lubrication design can yield high efficiency while maintaining manageable thermal loads. Compared with experimental and analytical studies (Santapaola, 2022; Fernandes, 2015), the present gearbox shows excellent performance, suggesting that only minimal cooling measures are required under steady operation.
Table 8.
Power loss distribution in the cabbage transplanter gearbox.
Despite the promising findings, this study has certain limitations. Most of the presented results, including transmission efficiency, power loss, and transmission error, are derived from simulations. Since no experimental validation was conducted, the reliability of these results under actual field conditions remains uncertain. To address this limitation, future research will involve developing experimental prototypes and performing field tests to verify the simulation outcomes and further refine the proposed approach. In addition, future work will incorporate variable load conditions typical of transplanting operations, enabling a more realistic evaluation of gearbox performance and improving predictions of efficiency, durability, and reliability.
Conclusions
This research investigated the optimization, fine sizing, and performance evaluation of a three-stage gearbox designed for a semi-automatic cabbage transplanter. By applying ISO 6336 standards and employing mechanical simulation tools, the study demonstrated how systematic geometric optimization can yield efficient and reliable gearbox designs. A total of 386, 278, and 418 candidate solutions were identified for the first, second, and third stages, respectively, from which optimized designs were selected. These optimal solutions satisfied both load-bearing and geometric constraints, with torque capacities of 16–17 Nm, 12 Nm, and 12–13 Nm for Stages 1–3.
The results show that tooth root safety was consistently high, with values greater than 5 across all stages, significantly exceeding ISO-recommended minimums. Flank safety factors, although lower (2.0–2.9), remained within acceptable ranges, thereby confirming surface durability (pitting resistance) as the limiting design criterion. Power loss analysis further revealed that gear meshing accounted for the majority of the total losses (30.1 W), whereas bearing and shaft losses were negligible. Nonetheless, the gearbox achieved an overall efficiency of 95.4%, placing it among high-performance industrial gear units.
The study highlights the importance of balancing face width, module, and center distance to minimize stresses while ensuring compactness and weight efficiency. It also emphasizes the value of ISO/TR 14179-based power loss assessment in understanding the thermal and efficiency behavior of gear systems. Future work should include experimental validation of the simulation results and the introduction of profile modifications to further reduce transmission error and enhance durability. These findings contribute to the advancement of optimized gearboxes for agricultural machinery, ensuring both operational reliability and long-term service life.
