


Introduction
Materials and Methods
Laboratory test bench for experimental evaluation
Setup and integration of the vision-based image acquisition module
Vibration platform calibration
Mass measurement tests under slope and vibration
Measurement of radish physical properties
Proposed image processing algorithm
Statistical analysis
Results and discussion
Comparison of mass measurement under slope conditions
Comparison of mass measurement under vibration conditions
Comparison of mass measurement using combined slope and vibration conditions
Conclusions
Introduction
The increasing global population necessitates a substantial rise in food production, with projections indicating a required increase of approximately 70% by 2050 to ensure food security (UN, 2022). However, despite advancements in crop productivity and genetic potential, agricultural output continues to face significant risks due to the impacts of climate change (Vogel et al., 2019). This shows the urgency of adopting advanced technological solutions capable of addressing spatial variability in crop yields at the field level. Additional factors, such as labor and time-intensive cultivation procedures, have been cited as contributing to the decline in radish cultivation rates in many countries (Kiraga et al., 2023; Chowdhury et al., 2020), which impacts the subsequent yields. These procedures include harvesting operations which are regarded among the most labor-intensive processes. These include pulling radish out from the soil, collecting it, measurement, and carefully transporting it to avoid damage. Recently, several research studies have been conducted towards mechanization of the radish harvesting process (Kiraga et al., 2025; Chowdhury et al., 2020), specifically, development of machines for on-the go soil excavation and radish extraction from the soil as well as its transportation to the collection point. Further research is essential to develop real-time yield measurement systems that can effectively capture the spatio-temporal variability of crop production under dynamic field conditions.
Effectively capturing yield variability demands both appropriate technological infrastructure and robust data processing methods. Recent developments in optical sensing technologies have significantly improved the acquisition and analysis of yield monitoring data (Kabir et al., 2024; Franch et al., 2019). Several studies have been conducted to estimate the yield of different crops utilizing these optical techniques, specifically, vision cameras. However, limited studies have evaluated the effect of field conditions on the performance of these systems for yield monitoring applications.
Optical sensor performance in agricultural machinery is often compromised by sinusoidal vibrations induced by uneven terrain and mechanical disturbances (Zhou et al., 2014). These vibrations typically originate from moving components and varying field slopes (Mailander et al., 2010), resulting in image degradation due to jitter noise (Jang et al., 2020). While several vibration compensation algorithms have been proposed in fields such as medical imaging (Fan et al., 2020; Xiong et al., 2023), their applicability remains limited due to domain-specific assumptions and their ineffectiveness against mechanical jitter in agricultural settings. Structural solutions, such as the integration of vibration-resistant mounts, have also been explored to enhance the stability of yield monitoring systems (Pelletier and Upadhyaya, 1999; Zhou et al., 2014). However, these designs often entail higher costs and still fall short of mitigating random vibrations under dynamic field conditions.
Although precision agriculture technologies, including yield monitoring systems, offer significant advantages for high-value crops, their widespread development and adoption have been constrained by the diversity of harvesting methods employed across crop types (Ehsani and Karimi, 2010). Accurate yield estimation is particularly crucial for root vegetables like radish, where irregular shapes and field variability pose additional challenges. Designing effective systems requires a thorough understanding of varying field conditions and the operational dynamics of harvesting machinery. In particular, vision-based systems are highly sensitive to mechanical vibrations induced by uneven terrain, which can compromise data quality and system accuracy. As global demand increases and agricultural operations face pressure to enhance productivity while minimizing waste, there is a growing need for robust, non-destructive yield monitoring tools. To address this challenge, the present study developed a vision-based framework and proposed an evaluation algorithm to quantify the effects of vibration and slope conditions on radish mass estimation. These factors were systematically simulated using a controlled laboratory test bench to replicate field harvesting dynamics.
Materials and Methods
Laboratory test bench for experimental evaluation
To replicate the operational dynamics of radish harvesting systems under controlled conditions, a custom experimental test bench was constructed. The design was inspired by the mechanical layout and working conditions typical of conveyor-integrated root crop harvesters. As detailed in Table 1, the system comprises three main components: a slope-adjustable frame, a conveyor unit, and a vibration platform.
Table 1.
Technical specifications of the vibration table, slope platform, and conveyor system used in the laboratory test bench for simulating field harvesting conditions.
To simulate varying field slopes, the conveyor system was mounted on an slope-adjustable platform as shown in Fig. 1(a) powered and controlled by a hydraulic powered motor system for the slope adjustment interface. This configuration enabled experiments at multiple pitch angles, mimicking real-world terrain conditions encountered during harvesting. A secondary conveyor belt identified as the most suitable location for mounting the vision module was integrated into the test bench. This belt as shown in Fig. 1(b) facilitated stable transport of radish samples for imaging purposes. The structural frame supporting the conveyor system was assembled using aluminum profiles (40×40 mm), providing both modularity and rigidity for component attachment. Simultaneously, mechanical vibrations commonly induced by uneven terrain or machine motion were reproduced using a vibration table as shown in Fig. 1(c) equipped with two rotating disks under the table to make vibration motion. The vibration intensity was modulated by adjusting the rotational speed (rpm) of the motor and the eccentricity of the masses.
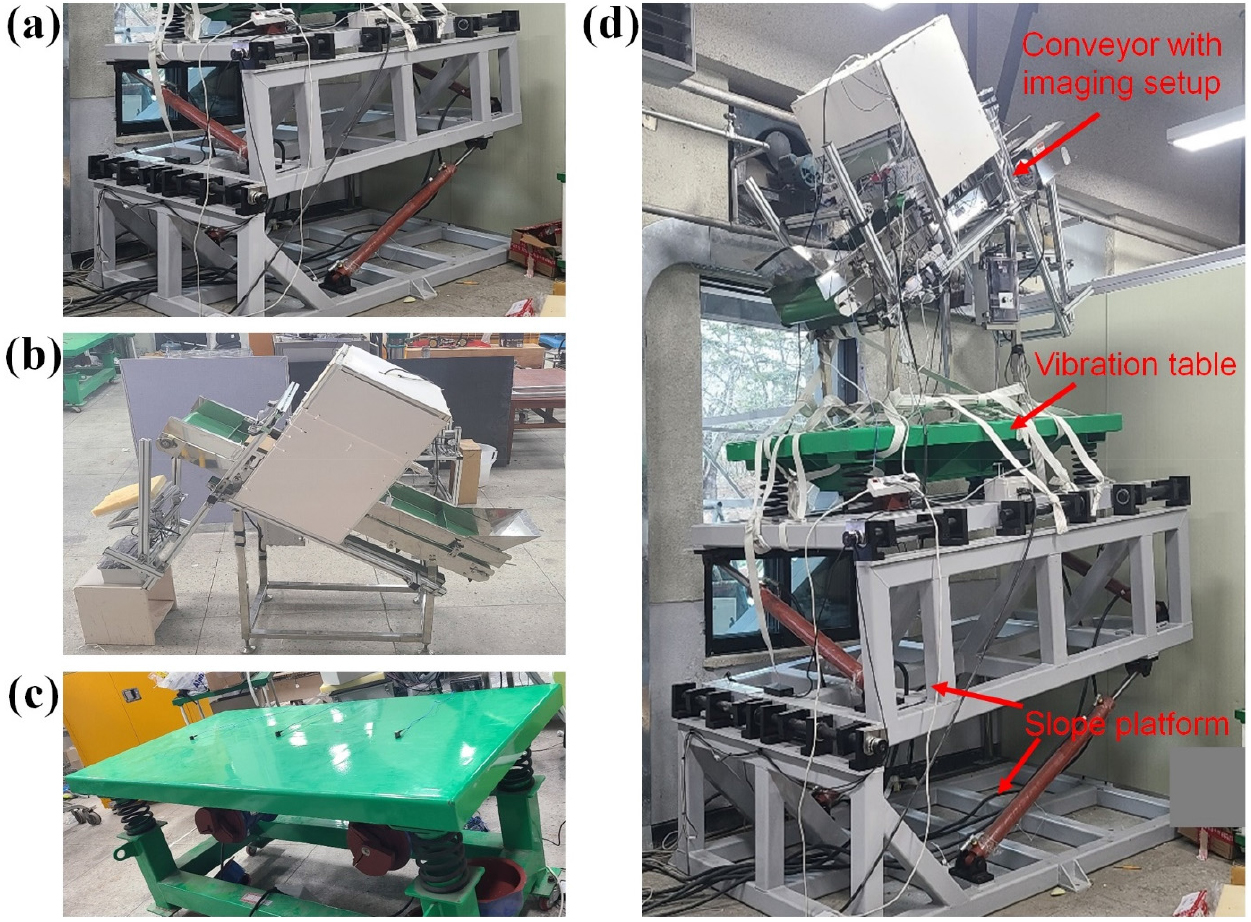
During testing, the entire assembly was securely mounted: the conveyor unit rested atop the slope-adjustable platform, which was itself firmly affixed to the vibration table. Fig. 1(d) illustrates the full system configuration, with key components labeled: conveyour belt with the image acquisition setup, vibration table, and (slope adjustment mechanism.
Setup and integration of the vision-based image acquisition module
To enable accurate top-view imaging of radishes during motion, a vision-based acquisition system was designed and implemented as shown in Fig. 2. The setup included an industrial-grade charge-coupled device (CCD) camera (model: VCXG-15C; Baumer Holding AG, Frauenfeld, Switzerland) equipped with a GigE interface for high-speed data transfer, a calibrated D65 light source to maintain consistent illumination, a proximity sensor for triggering, and a control laptop for image processing and storage. The camera was fixed vertically at a height of 30 cm above the conveyor belt to ensure a consistent overhead perspective aligned with the direction of radish flow.
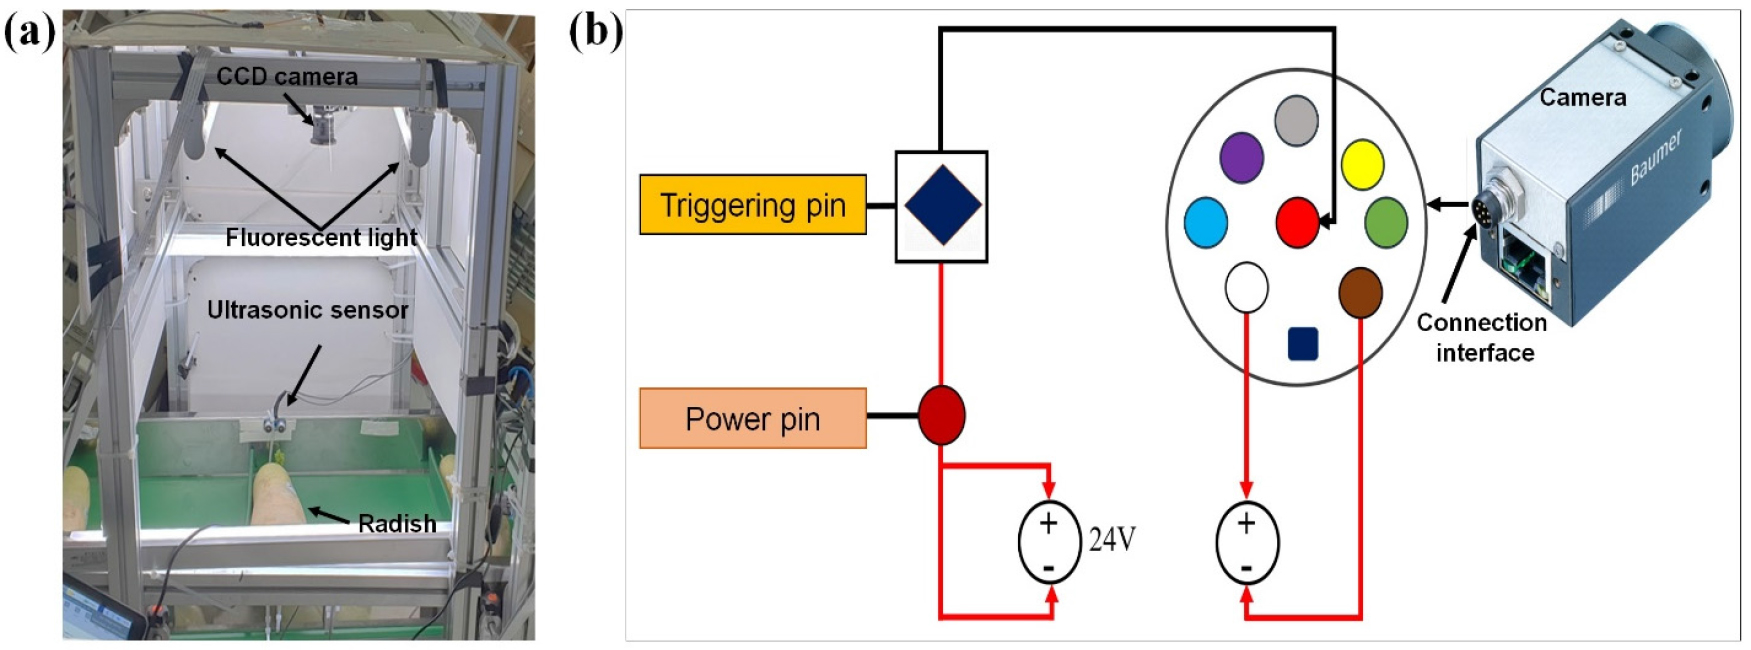
To automate the capture process, a proximity sensor was mounted laterally along the conveyor path. When a radish approached the imaging zone, the sensor triggered the camera to capture RGB images at a resolution of 1440 × 1068 pixels. The conveyor belt was operated at a steady speed of 0.05 m/s, and the camera exposure time was set to 10,000 µs. These parameters were optimized to minimize motion-induced blur while preserving image clarity for downstream mass estimation tasks.
Vibration platform calibration
Calibration of the vibration platform was conducted to assess its dynamic behavior and verify that the induced vibration levels corresponded to realistic field conditions. The system was operated at a fixed rotational speed of 275 rpm, during which the angular alignment of the eccentric blades was systematically varied across multiple test configurations to simulate different vibration patterns.
To quantify the platform’s oscillatory performance, three precision accelerometers (Model 356A15, PCB Piezotronics Inc., Depew, NY, USA) were mounted at separate structural points on the table. These sensors captured acceleration data along three principal axes—longitudinal (X), lateral (Y), and vertical (Z) representing the dominant directions of mechanical excitation observed during harvester operation.
The root mean square (RMS) acceleration in each axis was computed to determine the average effective vibration level (Aw), while the resultant vector magnitude (Av) was derived to represent the overall vibration intensity, as defined by Equations (1) and (1) (Kiraga et al., 2025). A total of 32 calibration scenarios were executed, with measurements recorded at a sampling frequency of 1,000 Hz to ensure precise temporal resolution and robust signal characterization.
Mass measurement tests under slope and vibration
To evaluate the accuracy of radish mass estimation under dynamic harvesting conditions, a set of controlled experiments was conducted under three operational scenarios: (i) vibration-only, (ii) slope-only, and (iii) combined vibration and slope. For the individual treatments, the test bench was mounted either on the vibration table or the slope-adjustable platform. In the combined condition, the vibration table—along with the mounted test setup—was installed atop the slope platform to simulate concurrent pitch and mechanical oscillations.
The slope conditions were selected based on practical limits recommended for agricultural machinery operation, with 15° (equivalent to a 26.79% gradient) cited as the upper threshold (Hong et al., 2017). Accordingly, three slope levels were chosen for testing: 3° (5.24%), 6° (10.51%), and 9° (15.84%). Regarding mechanical vibration, field measurements indicate that radish conveyor systems typically experience oscillations ranging from 0.37 to 0.48 m/s2 under load and from 1.01 to 1.66 m/s2 when unloaded (Chowdhury et al., 2020). Based on these findings, the experimental vibration intensities were limited to a maximum of 1 m/s2 to replicate in-field loaded operating conditions. Three discrete acceleration levels of 0.43, 0.78, and 0.98 m/s2 were applied during the vibration tests.
Given that radish harvesters typically operate at low velocities, a conveyor speed of 0.5 m/s was selected for all trials to reflect real-world mechanical movement. In the combined treatment, the vibration level was fixed at the lowest effective value of 0.43 m/s2, determined from prior trials, while slope conditions were varied across the same three angles (3°, 6°, and 9°). An overview of the experimental configurations for each condition is provided in Table 2.
Table 2.
Experimental variable combinations of conveyor speed, slope angle, and vibration intensity for single and combined condition tests used in radish mass estimation trials.
| Test condition | Conveyor speed (m/s) | Slope angle (°) | Vibration intensity (m/s2) |
| Slope only | 0.5 | 3 | – |
| 6 | |||
| 9 | |||
| Vibration only | – | 0.43 | |
| 0.78 | |||
| 0.98 | |||
| Combined slope and vibration | 6 | 0.43 | |
| 0.78 | |||
| 0.98 |
Measurement of radish physical properties
To establish ground truth data for model validation, the physical characteristics of each radish sample, mass was measured. The mass of individual radishes was recorded using a precision digital scale (Model SW-10, CAS Total Weighing Solution, Yangju, Republic of Korea), offering a measurement resolution of 5 grams.
All measurements were performed under consistent laboratory conditions to minimize variability due to external factors such as residual soil or moisture on the radish surface, air currents, and scale drift, which could influence the accuracy of weight readings. Each measurements were taken three times to reduce the inconsistency. These reference measurements served as the basis for evaluating the performance and accuracy of the vision-based radish mass estimation algorithm developed in this study.
Proposed image processing algorithm
Noise removal and feature extraction
According to Jang et al. (2018), mechanical vibrations induce additive jitter noise along the optical axis, which is considered Gaussian, and the noise cannot be detected by simply observing the image. In this research, a combination of a laplacian filter and a non-local means (NLM) denoising algorithm were used to reduce jitter noise. The detailed working principles of the Laplacian filter and the non-local mean algorithm have been extensively discussed in previously literature (Corner et al., 2003; Bhujle & Chaudhuri, 2013). The NLM filter can work on the entire image or with a defined window size to convolve the image and search for similar parches, which reduces the computational efficiency. In this study, a Laplacian filter with a 3×3 kernel and NLM with a search window of 15×15 and a patch size as 5×5 pixels were used.
The contrast of images was enhanced using histogram equalization (Abdullah-Al-Wadud et al., 2007), and then converted to grayscale. Then, a Gaussian otsu’s thresholding (Yousefi, 2011) was used, and a bounding box was drawn to extract the length and width of the processed radish sample. The eccentricity was determined by the following equation (Pathak et al., 2019):
Extreme learning machine
Extreme Learning Machine (ELM) is a feedforward neural network algorithm known for its rapid training process and high generalization capacity, particularly when applied to regression and classification problems. Introduced by Huang et al. (2004), the ELM architecture employs a single hidden layer with randomly initialized input weights and biases, which remain fixed during training. This eliminates the need for iterative weight updates, enabling significantly faster model convergence compared to conventional learning algorithms.
The technique has gained considerable attention across diverse application domains such as bioinformatics (Lee et al., 2013), time-series forecasting (Wang and Han, 2014), and hydrological modeling tasks, including evapotranspiration estimation (Abdullah et al., 2015). Key advantages of ELM include minimal parameter tuning, ease of implementation, and the ability to handle nonlinear relationships effectively.
In this study, ELM was employed to model and predict the mass of radish samples based on geometric features. Two input features—mass and eccentricity—were used as predictors. These features were projected into an L-dimensional space using randomly assigned input weights, forming the hidden layer output matrix. The model output, representing the estimated radish mass, was computed by determining the optimal output weights through a least-squares solution.
where, L is the number of hidden neuron, β is the matrix of output weight between hidden neurons and output neurons, H are the hidden neuron outputs for input x.
Genetic algorithm
The main limitation of the ELM framework lies in its reliance on randomly initialized input weights and hidden biases, which may result in suboptimal predictive performance. To address this issue, a Genetic Algorithm (GA) was integrated into the modeling process to optimize these parameters and enhance the accuracy of radish mass estimation.
GA is a population-based metaheuristic inspired by the principles of natural selection and genetic evolution. It has been successfully applied to a range of nonlinear optimization tasks (Liu and Chung, 2014) and has demonstrated its effectiveness in fine-tuning machine learning models across agricultural domains (Peerlinck et al., 2019; Bi and Hu, 2021). In the present study, GA was used to systematically evolve the ELM’s input parameters, guiding the search toward an optimal solution space by applying operations such as selection, crossover, and mutation.
In the GA framework, optimization begins with a population of candidate solutions, each represented as an individual or chromosome. These chromosomes encode potential solutions to the objective function and evolve over successive generations through biologically inspired operations—namely, selection, crossover, and mutation. Based on the principle of “survival of the fittest,” GA incrementally improves the population by favoring individuals with higher fitness values, thereby guiding the search toward near-optimal solutions.
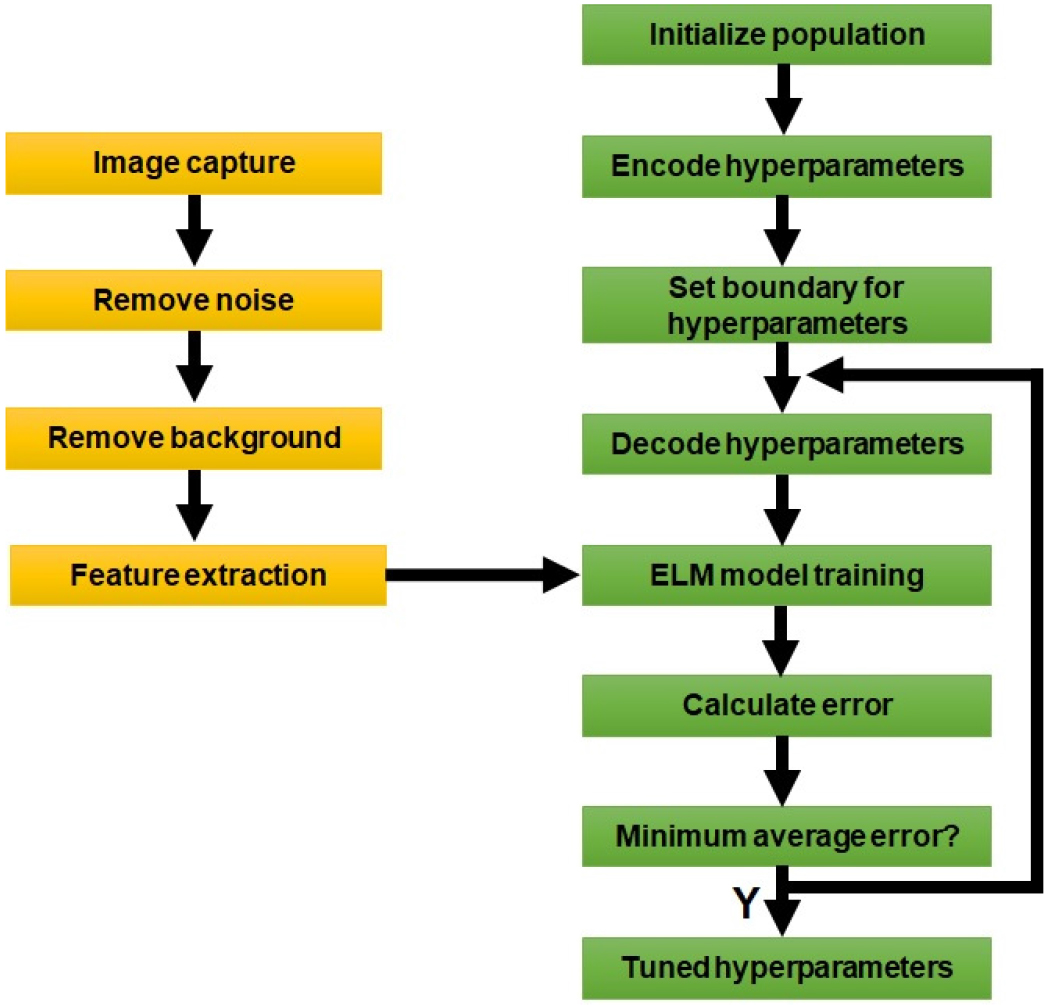
This evolutionary process enables GA to efficiently explore large solution spaces and converge on suitable parameter configurations with reduced computational overhead. Consequently, GA has proven effective in enhancing machine learning models by optimizing their structural parameters. In the context of this study, GA was employed to fine-tune the input weights and the number of hidden neurons in the ELM model. These parameters were encoded as genes within a chromosome vector, and the GA iteratively refined them to improve the model’s predictive accuracy. The complete workflow of the GA-ELM optimization approach used in this study is illustrated in Fig. 3.
Statistical analysis
To evaluate the accuracy of the proposed mass estimation method, statistical comparisons were made against the actual measurements obtained through the weight measurement technique. Specifically, a paired t-test was conducted to assess whether the differences between the actual abd predicted masses were statistically significant under each experimental condition. In addition, confidence intervals for the mean differences were calculated to quantify the precision and potential bias of the algorithm’s predictions.
All statistical computations and visualizations were performed using the R statistical environment (version 4.2.1, RStudio Inc., USA). This dual approach—combining inferential testing with confidence interval estimation—provided a robust framework for validating the consistency and reliability of the vision-based mass measurement system.
Results and discussion
Comparison of mass measurement under slope conditions
Fig. 4 illustrates the relationship between actual radish masses obtained through wight scale measurments and those predicted using the proposed algorithm under three slope conditions: 3°, 6°, and 9°. The coefficient of determination at 3° , 6°, and 9° slope levels indicate a strong correlation across all cases, with R2 values of 0.93, 0.92, and 0.94, respectively.
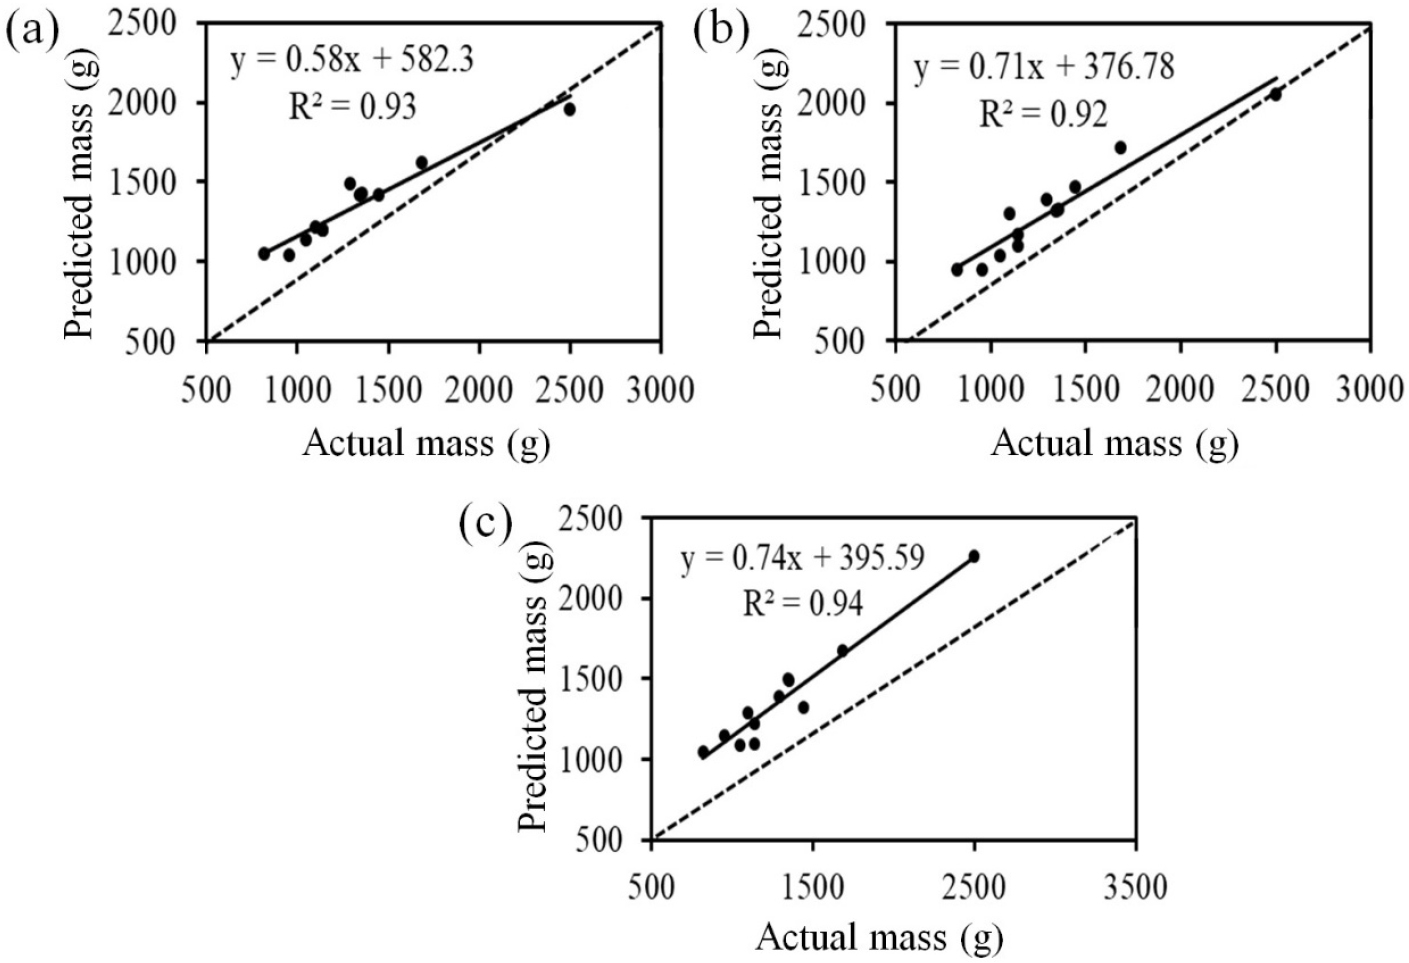
The mean mas difference between slope levels 3° (D3), 6° (D6), 9° (D9) and weight balance were; D3 = −30.54 g , D6 = 2.63 g, D9 = −58.04 g (95% confidence interval: D3 = −343.13 and 282.05 g, D6 = −330.56 and 335.81 g, D9 = −395.56 and 279.48 g). From the slopes of the fitted lines shown in Fig. 4, it is evident that radish mass was underestimated at all slope levels compared to the actual weight measurement. Koc (2007) showed a similar study on watermelon volume estimation, changes in the vertical distance between the object and camera can significantly alter perceived object dimensions, particularly for larger or irregularly shaped produce.
This effect is visually demonstrated in Fig. 5, where the same radish sample appears to occupy progressively less projected area as the slope angle increases. The reduction in visible surface area may have led to smaller extracted size features, such as length and width, ultimately influencing the computed mass. As the slope increases, the visible top-view area decreases, which likely contributes to underestimation in mass predictions by reducing the size of features extracted from images.
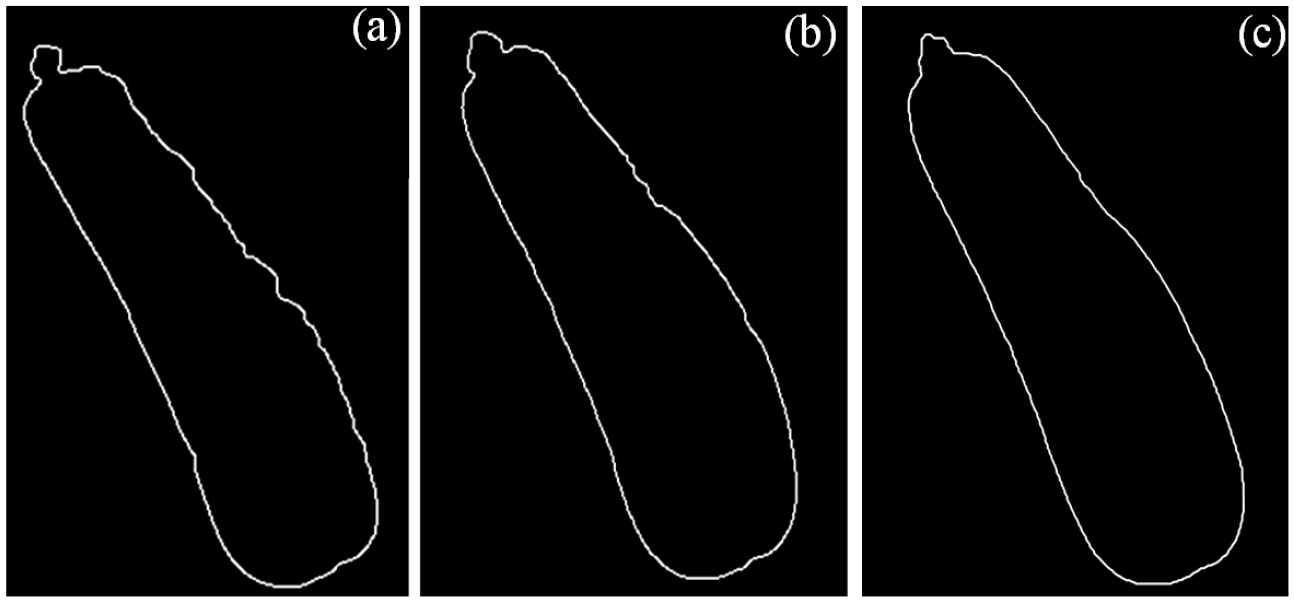
Despite these geometric distortions, statistical analysis using paired t-tests revealed no significant differences between the algorithm masses and the actual measurements from the weight balance method across all tested slopes. The P-values were 0.83, 0.99, and 0.72 for 3°, 6°, and 9°, respectively, as shown in Table 3, indicating that the observed differences were not statistically significant. This highlights the robustness of the proposed method and underscores the importance of accounting for perspective distortion in vision-based mass estimation systems operating on sloped surfaces.
Table 3.
Paired t-test results comparing radish volume estimates from the proposed algorithm with actual measurements under different slope conditions.
| Slope angle (°) | Statistical result | P-value |
| 3° | No significant difference | 0.83 |
| 6° | No significant difference | 0.99 |
| 9° | No significant difference | 0.72 |
Comparison of mass measurement under vibration conditions
Fig. 6 presents the regression analysis comparing predicted and measured radish mass values under three different vibration intensities: 0.43, 0.78, and 0.98 m/s2. The R2 values for these conditions were 0.97, 0.94, and 0.95, respectively, indicating a strong correlation between the algorithm-predicted and reference volumes across all vibration levels. Among these, the lowest vibration level (0.43 m/s2) yielded the highest accuracy, with a regression slope of 0.87 closest to unity suggesting that the prediction closely approximated the actual mass.
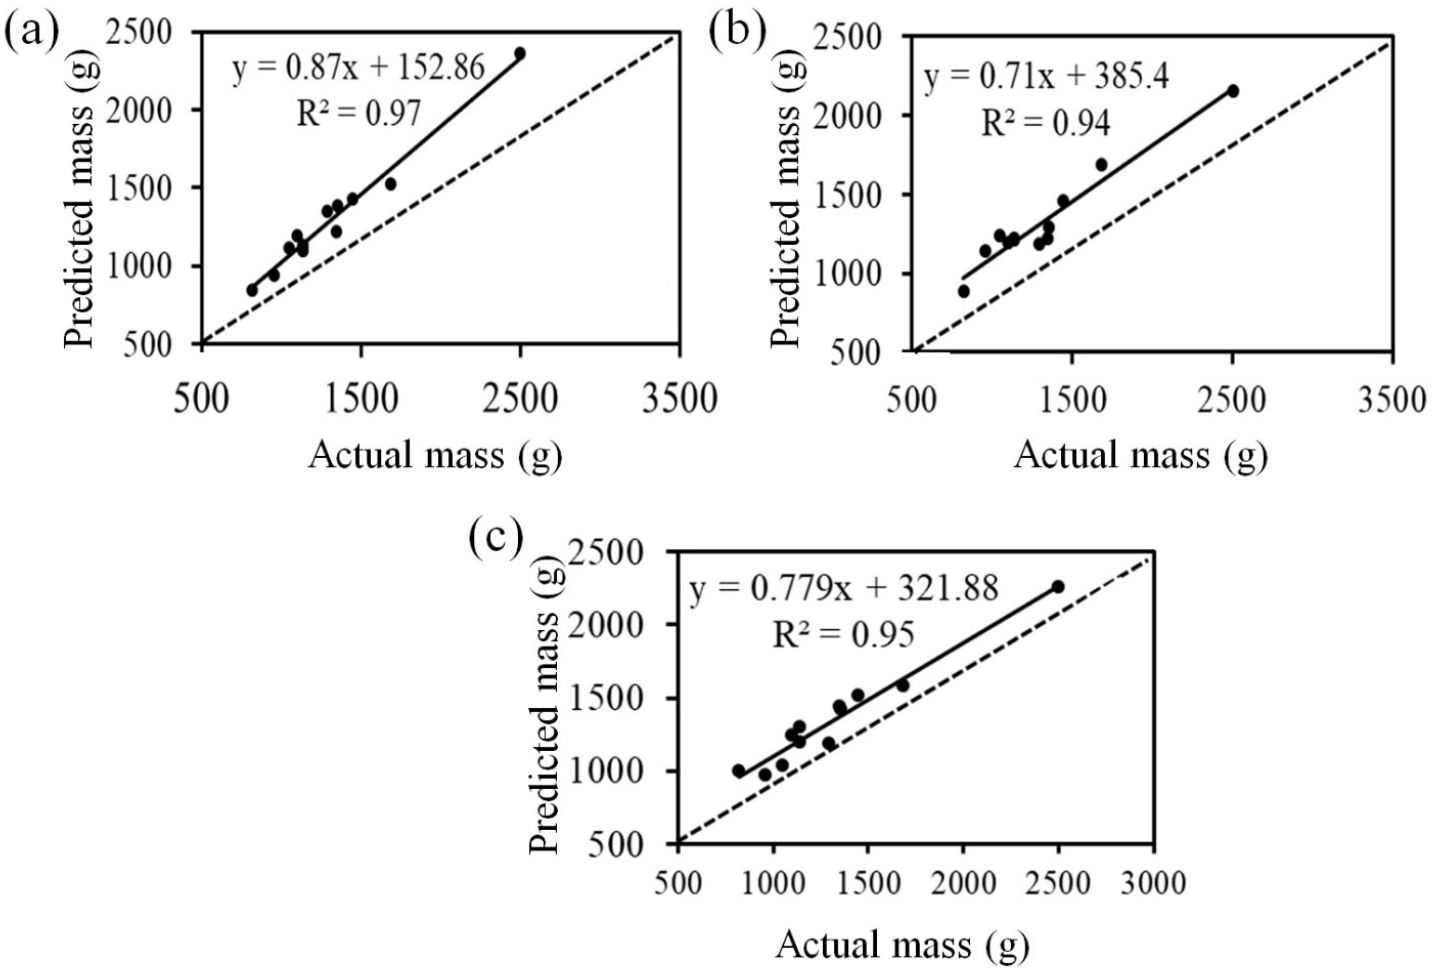
Despite high correlation values, all regression slopes were below 1.0, confirming a consistent tendency to underestimate mass across all vibration conditions. The mean prediction errors (D0.43, D0.78, D0.98) compared to water displacement were 17.79 g, –7.54 g, and –58.04 g, respectively. The corresponding 95% confidence intervals ranged from –339.12 to 374.71 g for D0.43, –339.86 to 324.79 g for D0.78, and –372.92 to 312.18 g for D0.98, indicating that the differences were statistically insignificant despite numerical variation.
The observed underestimation may be attributed to the effect of mechanical vibrations on the vision system during image acquisition. As illustrated in Fig. 7, the vibration sensor signals revealed distinct spectral characteristics across the x, y, and z directions. A prominent frequency peak around 100 Hz was detected in the x-direction (Fig. 7(a)), while the y- and z-axis responses (Fig. 7(b) and 7(c)) displayed broader spectral distributions, indicating increased randomness. In all cases, the dominant vibration energy remained below 200 Hz. These fluctuations likely introduced image jitter and motion blur, affecting the precision of shape-based feature extraction and ultimately contributing to volume underestimation at higher vibration intensities.
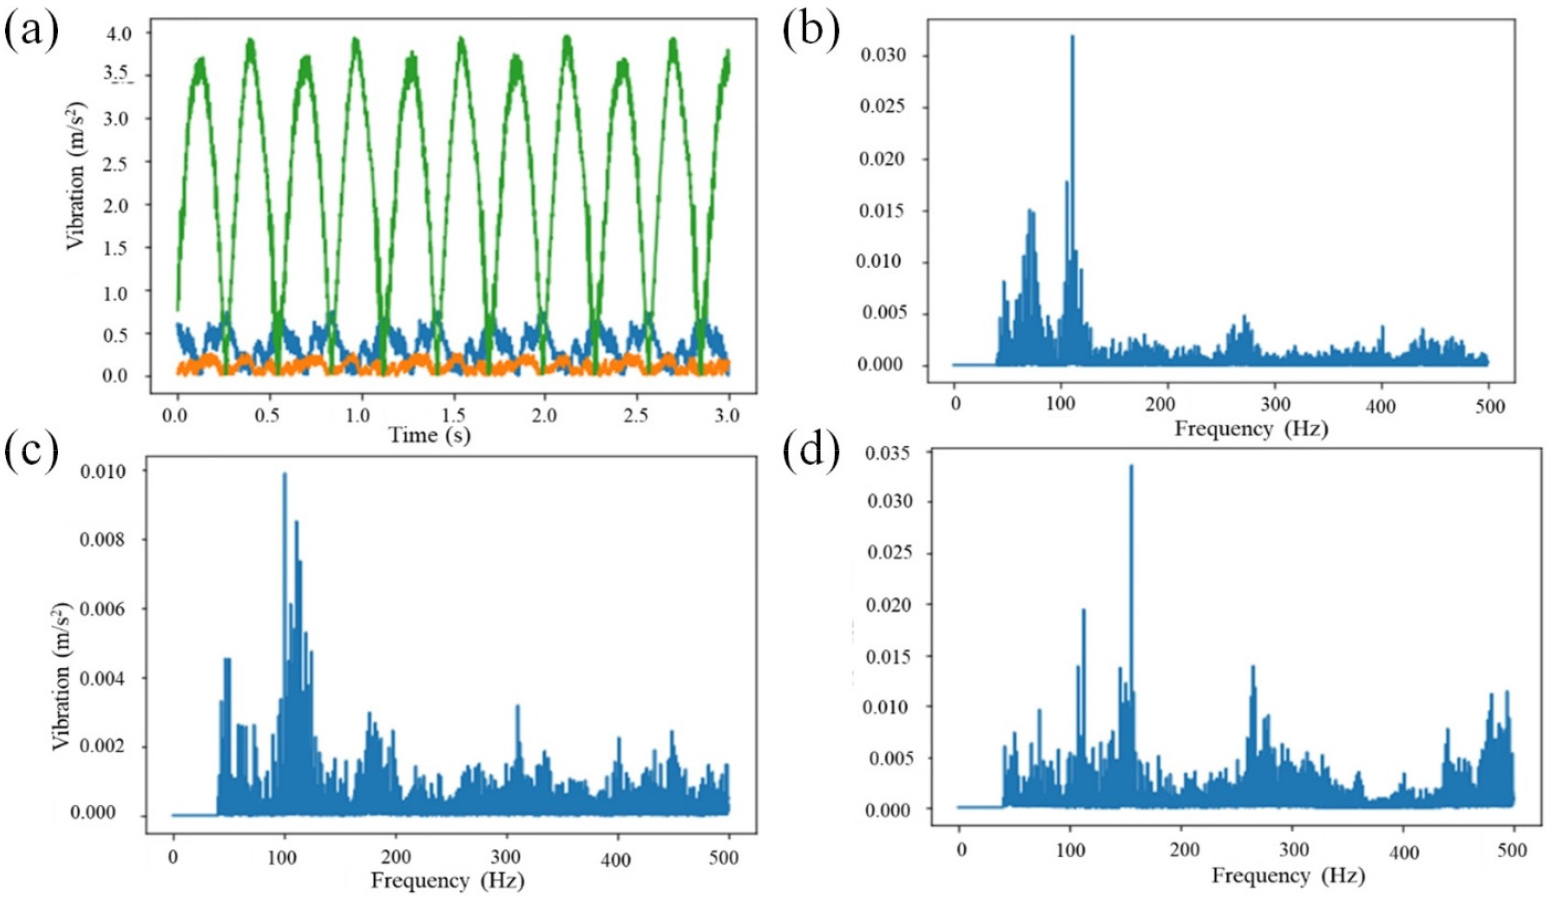
Fig. 7
Analysis of mechanical vibrations recorded by tri-axial sensors on the test bench system. (a) Time-domain vibration signals in the z (green), y (blue), and x (orange) directions; (b–d) corresponding discrete Fourier transform (DFT) spectra in the x, y, and z directions, respectively, showing dominant frequency components.
Although vibration-induced disturbances could potentially affect the accuracy of image-based radish mass estimation, the paired t-test results summarized in Table 4 indicate that the differences between predicted values and those measured via water displacement were not statistically significant at any of the tested vibration levels (0.43, 0.78, and 0.98 m/s2). With P-values of 0.92, 0.96, and 0.85 respectively, these findings confirm the consistency and reliability of the proposed algorithm across varying vibration intensities.
Table 4.
Paired t-test results comparing radish mass estimates from actual amd proposed algorithm measurements under different vibration conditions.
| Vibration level (m/s2) | Statistical result | P-value |
| 0.43 | No significant difference | 0.92 |
| 0.78 | No significant difference | 0.96 |
| 0.98 | No significant difference | 0.85 |
Comparison of mass measurement using combined slope and vibration conditions
Fig. 8 illustrates the regression analysis between predicted and actual radish mass under combined slope (6°) and vibration conditions at three intensity levels: 0.43, 0.78, and 0.98 m/s2. The coefficient of determination (R2) values were 0.98, 0.94, and 0.97, respectively, indicating a strong linear association between the algorithm’s predictions and the reference measurements obtained through the water displacement method.
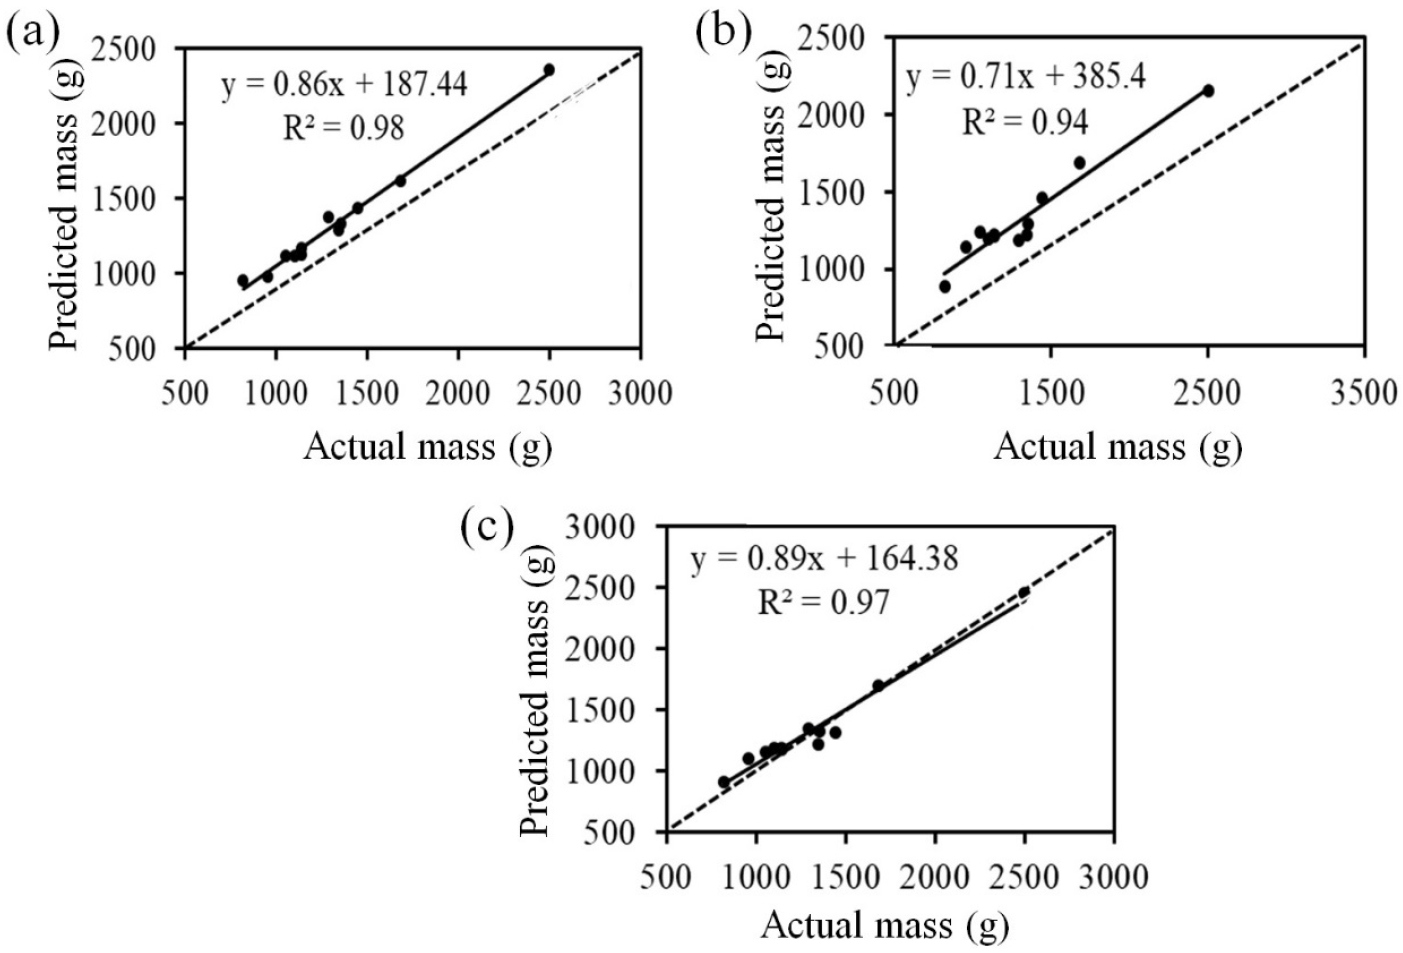
Despite the high R2 values, the slopes of the regression lines (0.86 for 0.43 m/s2, 0.71 for 0.78 m/s2, and 0.89 for 0.98 m/s2) suggest a systematic underestimation of radish mass at all vibration levels when superimposed with slope inclination. The degree of underestimation varied slightly, with the closest fit to the 1:1 line observed at the lowest vibration intensity (0.43 m/s2). The mean mass deviations from the water displacement values were –3.37 g (D0.43), –29.71 g (D0.78), and –23.04 g (D0.98), with corresponding 95% confidence intervals of –357.22 to 350.47 g, –359.42 to 300.01 g, and –384.49 to 338.42 g, respectively. These wide intervals, encompassing zero in all cases, suggest no statistically significant bias in the predictions.
This was further confirmed by the paired t-test results shown in Table 5. Table 5 summarizes the results of the paired t-tests comparing radish mass estimated by the proposed vision-based algorithm and the values measured via water displacement under a fixed slope of 6° and varying vibration levels. The P-values of 0.98, 0.85, and 0.89 for the 0.43, 0.78, and 0.98 m/s2 vibration levels, respectively, indicate no statistically significant differences. This reinforces the model’s robustness in accurately estimating mass even under combined slope–vibration conditions.
Table 5.
Paired t-test results comparing radish mass estimated by the actual and proposed algorithm measurement under a 6° slope and varying vibration conditions.
| Slope (°) | Vibration level (m/s2) | Statistical result | P-value |
| 6 | 0.43 | No significant difference | 0.98 |
| 0.78 | No significant difference | 0.85 | |
| 0.98 | No significant difference | 0.89 |
To enhance the accuracy of radish mass estimation, future studies should explore alternative machine learning algorithms that incorporate a broader range of size and shape features. Previous research has demonstrated the potential of various predictive models for mass estimation (Nyalala et al., 2019; Örnek and Kahramanlı Örnek, 2021), providing a solid theoretical foundation. However, many of these approaches are limited in scope and lack generalizability across different operational contexts.
The successful development of a robust, field-ready yield monitoring system for radish will require addressing several practical constraints, including light occlusion, environmental variability, and the need for precise and adaptable image processing techniques. To ensure reliability and scalability, further testing under diverse experimental conditions—such as varying exposure times, conveyor speeds, vibration levels, and slope angles—will be essential for optimizing system performance and ensuring consistent accuracy under real harvesting conditions.
Conclusions
This study proposed a vision-based algorithm for radish mass estimation using a genetic algorithm–optimized extreme learning machine (GA-ELM), tested under simulated harvesting conditions via a laboratory test bench. The model utilized two key input features, mass and eccentricity to predict radish weight across various slope and vibration scenarios. Statistical comparisons with reference measurements obtained via the water displacement method revealed no significant differences, despite a general tendency for the algorithm to slightly underestimate mass. High coefficients of determination (R2 = 0.94, 0.95, and 0.98 for 9°, 0.43 m/s2, and combined 6° slope with 0.43 m/s2 vibration, respectively) validated the model’s predictive reliability.
The approach demonstrates potential for broader application in estimating the mass of other similarly shaped horticultural crops. Notably, the use of eccentricity as a surrogate for density provides a practical alternative in real-time systems, particularly for irregularly shaped produce where direct density measurement is impractical.
Future work should address the algorithm’s adaptability to field environments, where dynamic natural lighting and machine integration pose significant challenges. While an indoor lightbox was used to eliminate lighting variability in this study, the effectiveness of the system under outdoor, fluctuating light conditions must be evaluated. Furthermore, the integration of the imaging setup into actual radish harvesting machinery warrants detailed structural analysis. Finally, investigating alternative color spaces beyond RGB may enhance feature robustness under varying illumination, improving system generalizability and real-world performance.