

Introduction
Materials and Methods
Overview of the greenhouse simulator and sensor node deployment
Smartphone application for data acquisition and remote monitoring
Environmental sensing and hybrid ANN-Kalman temporal modeling
Actuator control and analytical procedures
Performance evaluation procedure
Results
Environmental monitoring and control
Monitoring and control performance with the hybrid model
Smartphone application features for monitoring and control
Discussion
Conclusion
Introduction
Greenhouse production systems represent a core component of precision agriculture, where environmental regulation directly determines crop growth dynamics, yield stability, and resource-use efficiency (Getahun et al., 2024; Padhiary et al., 2025). Among environmental variables, air temperature and relative humidity dominate plant transpiration, photosynthesis efficiency, pathogen development, and vapor pressure deficit regulation (Pokhrel, 2021; Elad and Pertot, 2014). Accurate monitoring and reliable actuator feedback are therefore prerequisites for implementing closed-loop greenhouse climate control strategies.
Conventional greenhouse control architectures typically employ sparse, fixed-point sensors combined with threshold-based or rule-based actuator logic (Zhang et al., 2022). Although ventilation fans effectively regulate heat removal and humidity balance through forced convection (Liang et al., 2022), spatial heterogeneity within the greenhouse canopy often results in microclimatic gradients that are not captured by limited sensing points. Furthermore, actuator commands are frequently executed without quantitative verification of electrical behavior (power/current response) or environmental response consistency, limiting traceability between control input and system output.
Recent advances in wireless sensor networks (WSNs), Internet of Things (IoT) frameworks, and lightweight communication protocols such as Message Queuing Telemetry Transport (MQTT) enable scalable, distributed environmental monitoring architectures (Bicamumakuba, et al., 2025a). Multi-node sensing improves spatial resolution and allows the characterization of environmental variance and node-to-node deviation. Smartphone-based interfaces further extend system accessibility, enabling real-time visualization, actuator triggering, and remote supervisory control (Slimani et al., 2025). However, reliable decision-making requires not only data acquisition but also robust temporal modeling capable of handling nonlinear dynamics and measurement noise (Bicamumakuba, et al., 2025b).
Greenhouse environmental dynamics during actuator transitions exhibit nonlinear and time-dependent characteristics governed by heat transfer, air exchange rates, and moisture diffusion processes. Artificial Neural Networks (ANNs) have been widely adopted to approximate such nonlinear mappings between environmental states and control inputs (Morales-García et al., 2023). Despite strong nonlinear fitting capability, standalone ANN models are susceptible to high-frequency sensor noise and rapid transient fluctuations, particularly during actuator switching events (Falotico et al., 2025). To address this limitation, hybrid state-space modeling frameworks that integrate ANN outputs with Kalman filtering provide enhanced temporal consistency (Feng et al., 2023). In this approach, the ANN serves as a nonlinear observation model, while the Kalman filter performs stability and suppresses high-frequency noise.
Advances in precision greenhouse management increasingly emphasize spatially resolved monitoring and reliable actuator verification, because conventional greenhouse systems often depend on single-point sensing and rule-based control that cannot capture localized microclimate variability or confirm whether actuators executed as intended (Xu et al., 2024a; Song et al., 2024). Accordingly, smartphone-based greenhouse interfaces have been widely explored as practical tools for real-time monitoring and manual control (Cafuta et al., 2021; Van et al., 2019), yet many reported applications remain centered on visualization and provide limited validation of actuator operation or predictive capability, leaving uncertainty in attributing environmental changes to control actions (Nemati et al., 2017). In parallel, data-driven models, particularly artificial neural networks (ANNs), have shown strong potential for representing nonlinear greenhouse environmental dynamics, but standalone ANN prediction can be vulnerable to measurement noise and abrupt actuator-driven transients, motivating hybrid approaches that improve stability and robustness (Roh et al., 2024). Moreover, reproducible evaluation of monitoring and control strategies in real greenhouses is often constrained by external weather disturbances, which motivates the use of controlled simulator-based testbeds to isolate actuator effects and systematically assess sensing, visualization, and prediction performance (Xu et al., 2024b).
Validation of greenhouse monitoring systems under real production conditions is often confounded by external disturbances such as solar radiation variability, ambient temperature shifts, and stochastic wind effects (Chen et al., 2025). Greenhouse simulators provide a controlled experimental testbed in which actuator-induced environmental responses can be isolated and repeatably quantified (Pawlowski et al., 2009). Such platforms enable pre-deployment validation of distributed sensing accuracy, actuator electrical response consistency, environmental response repeatability, and predictive model stability prior to field implementation (Choudhary, 2024; Bicamumakuba, et al., 2025b).
Therefore, the objective of this study was to develop and validate smartphone application-enabled greenhouse monitoring and actuator control using a simulator platform integrating distributed sensor nodes, MQTT-based data communication, actuator power/current monitoring, and a hybrid ANN-Kalman environmental prediction model.
Materials and Methods
Overview of the greenhouse simulator and sensor node deployment
A controlled greenhouse simulator was constructed as a repeatable indoor platform to evaluate distributed environmental monitoring, actuator performance, and model prediction under stable boundary conditions. The enclosure was installed indoors to minimize external disturbances (e.g., light, wind, and outdoor temperature variation), thereby isolating environmental responses attributable to actuator operation.
The greenhouse simulator is shown in Fig. 1(a). The simulator dimension was 2.53 m (L) × 2.0 m (W) × 2.0 m (H). As shown in Fig. 1(a), a ventilation fan was mounted at mid-height on the interior front wall to drive longitudinal airflow toward the rear along simulator length. The system also included a heating module near the rear floor region, a dehumidifier in the front-lower region, eight distributed environmental sensor nodes, and a centralized gateway for wireless data collection.
Each sensing node measured air temperature (°C) and relative humidity (%) and was deployed at two uniform heights to capture vertical and longitudinal gradients. The bottom layer comprised Nodes 1–4, with Nodes 1 and 3 in the front-lower region and Nodes 2 and 4 in the rear-lower region. The top layer comprised Nodes 5–8, with Nodes 5 and 7 in the front-upper region and Nodes 6 and 8 in the rear-upper region. This two-layer front–rear configuration enabled systematic quantification of airflow attenuation, vertical stratification, and thermo-hygrometric dynamics during repeated actuator ON– OFF experiments as shown in Fig. 1(b).
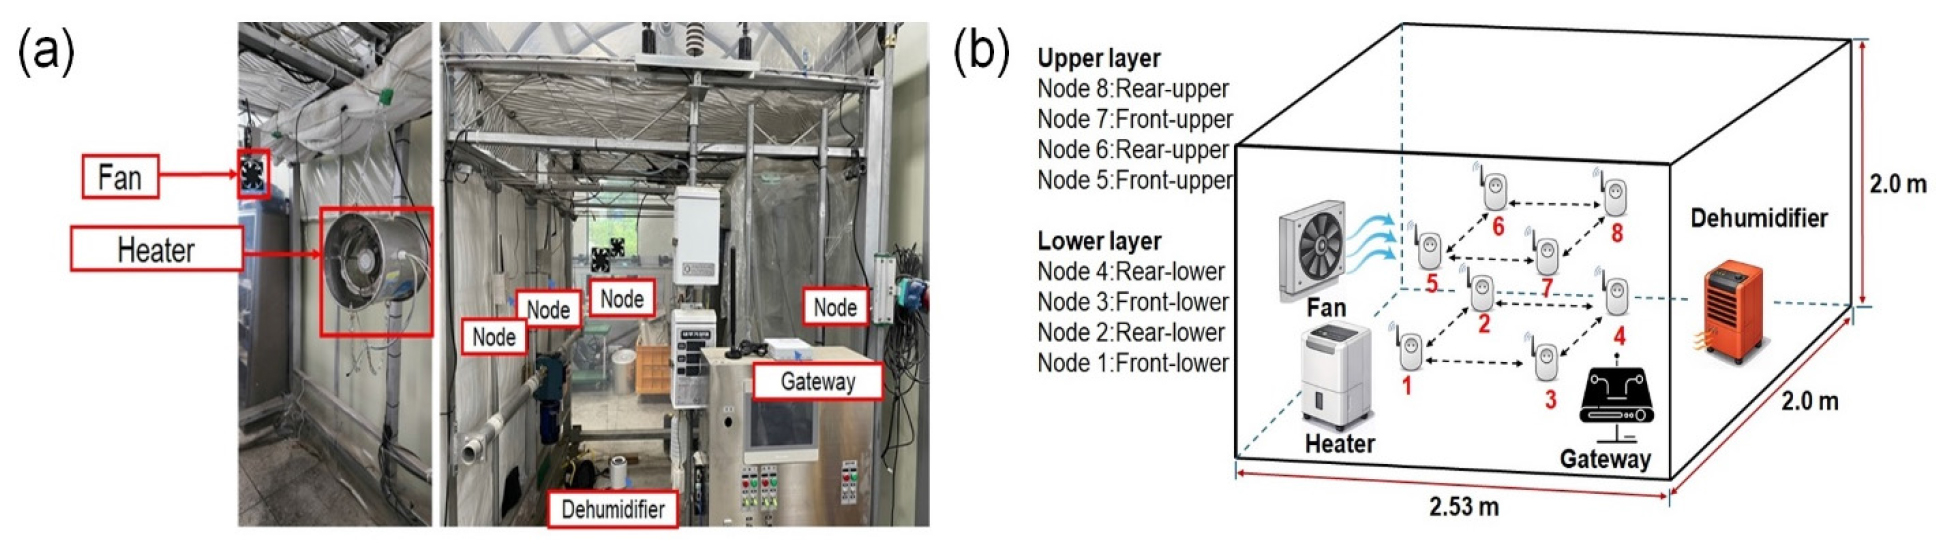
Fig. 1.
Greenhouse simulator configuration and experimental setup: (a) the greenhouse simulator showing physical installation of the ventilation fan, heater, dehumidifier, sensing nodes, and gateway unit, and (b) schematic diagram illustrating structural layout, actuator placement, airflow direction, and spatial distribution of sensor nodes.
Smartphone application for data acquisition and remote monitoring
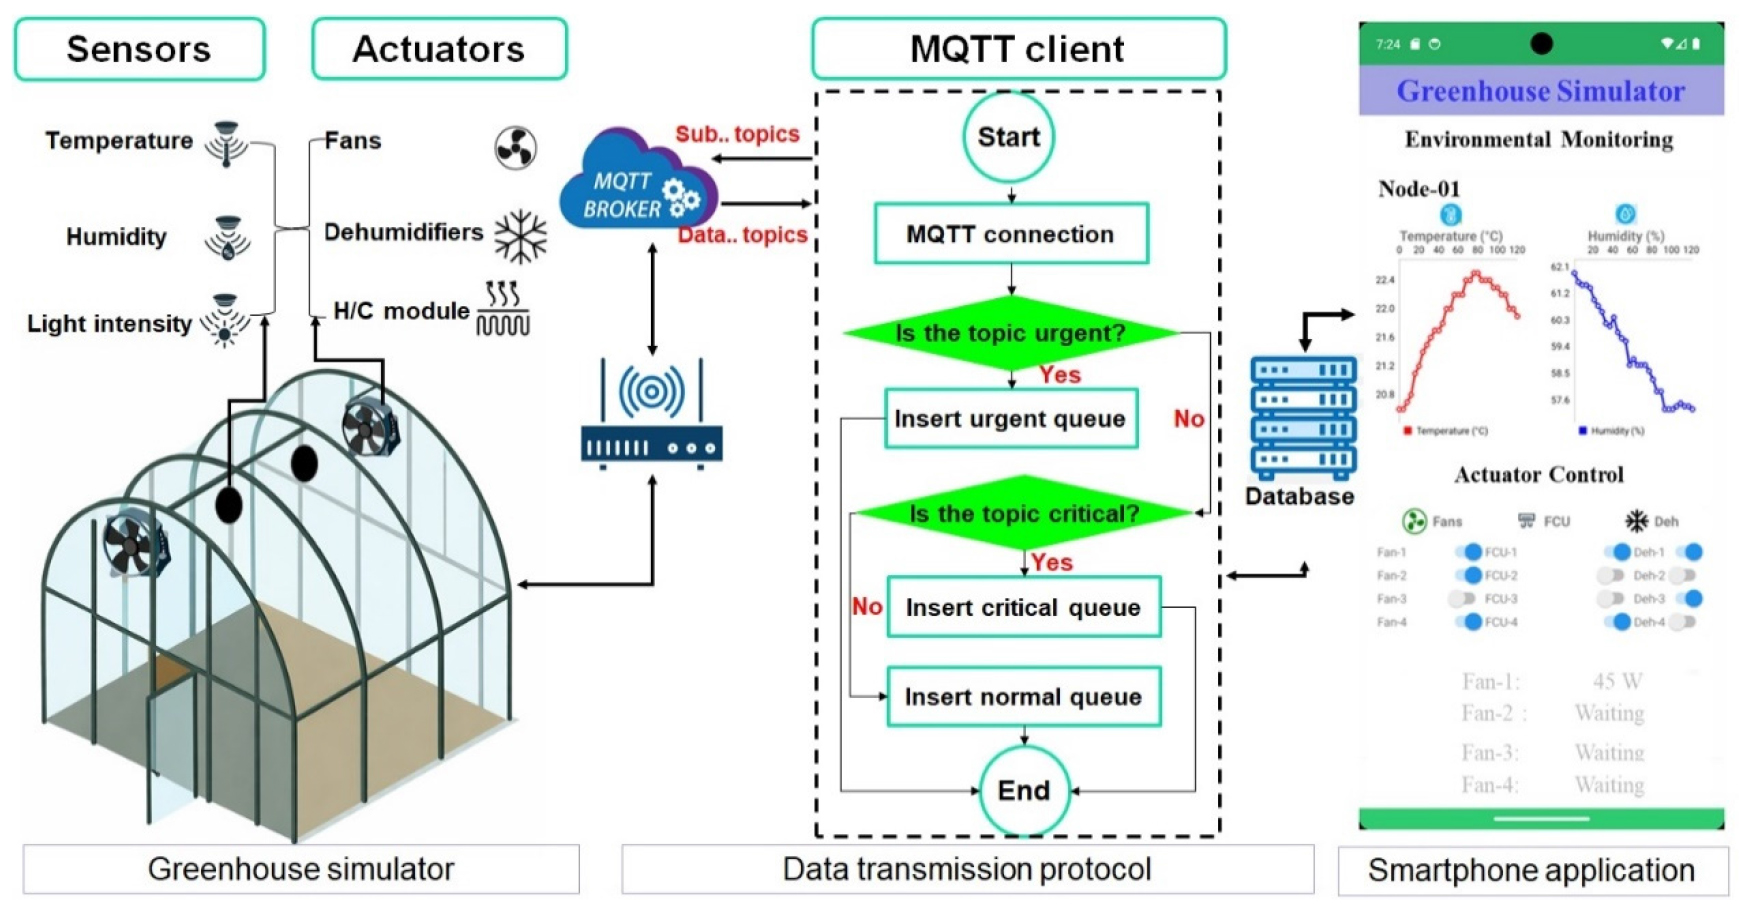
A smartphone application was developed as an integrated front-end for real-time acquisition, transmission, visualization, and verification of environmental and actuator data generated within the greenhouse simulator. The application operated as an MQTT client and was tightly coupled to the communication protocol and database layer to support reliable downstream processing for the model prediction.
Simulator measurements (air temperature and relative humidity) and actuator states (ventilation fan, dehumidifier, and heating/cooling modules) were transmitted via a gateway to a central MQTT broker. Environmental measurements were published under data topics, whereas actuator information was exchanged through control and status topics, enabling decoupled, asynchronous communication among the simulator, database, and smartphone interface.
The application subscribed to multiple MQTT topics and maintained a persistent connection for streaming data reception. Incoming messages were parsed according to a structured protocol and categorized by priority (urgent, critical, normal). Abrupt environmental changes and actuator state transitions were placed in priority queues, while routine measurements were processed through a normal queue. This queue-based handling stabilized performance during high-frequency updates and actuator-induced transients, reducing packet loss and visualization latency.
All processed data were synchronized to a centralized database for logging and retrospective analysis. In parallel, the application provided real-time numerical and graphical displays of node-level environmental measurements and actuator operating states. Manual actuator control was supported through MQTT command publishing, allowing users to trigger ON/OFF operations and verify execution through corresponding status updates and environmental responses. The overall architecture improved communication robustness and enabled closed-loop monitoring and verification is shown in Fig. 2.
Environmental sensing and hybrid ANN-Kalman temporal modeling
To characterize localized environmental dynamics driven by ventilation actuator operation, a multi-node environmental sensing and hybrid ANN-Kalman temporal modeling framework was implemented in the greenhouse simulator. The experimental setup comprised 8 spatially distributed measurement points, each independently recording temperature (°C) and humidity (%). Sensing node configuration enabled direct capture of spatially heterogeneous environmental responses to actuator operation, eliminating uncertainties associated with single-point measurements. The specification of sensors is shown in Table 1.
Table 1
Specifications of sensors used in the greenhouse simulator.
The total number of sensor nodes installed in the greenhouse simulator was defined as N=8 for each node , temperature, and humidity were recorded as time-series signals.
Where, and denote the measured temperature and humidity at the node and time index , respectively, and represents the total number of acquired samples. This formulation enables independent temporal modeling of environmental behavior at each node under ventilation-induced airflow conditions.
Raw environmental measurements were first inspected to remove missing samples. To ensure numerical stability during artificial neural network (ANN) training, temperature and humidity signals were normalized independently for each node using min-max scaling.
Where, and denote the raw temperature (°C) and humidity (%) measured at the node at time index ; and represent the minimum and maximum temperature values observed at the node over the entire measurement period; and represent the corresponding extrema for humidity; and were the normalized temperature and humidity signals were scaled to the range [0,1].
Node normalization preserves relative temporal patterns while preventing scale-induced bias across nodes and environmental variables. To capture short-term temporal dependencies associated with ventilation-driven environmental fluctuations, a sliding-window approach was employed to reformulate the normalized time-series data into supervised learning datasets. Fixed window length of time steps was selected based on empirical stability and prediction performance. For temperature prediction at the node , the supervised input-output relationship was defined as.
Where, and denote the input vectors formed by the previous normalized temperature and humidity observations at node , respectively; and represent the corresponding target outputs at time ; and is the sliding-window length used to capture short-term temporal dependencies in the environmental signals.
A compact feedforward ANN architecture was designed to learn short-term temporal relationships between successive environmental states under actuator-driven dynamics while maintaining computational efficiency. For each sensor node, separate ANN models were trained for air temperature and relative humidity prediction. Each network comprised a five-neuron input layer, two fully connected hidden layers with 64 and 32 neurons using ReLU activations, and a single linear output neuron for one-step-ahead prediction as illustrated in Fig. 3.
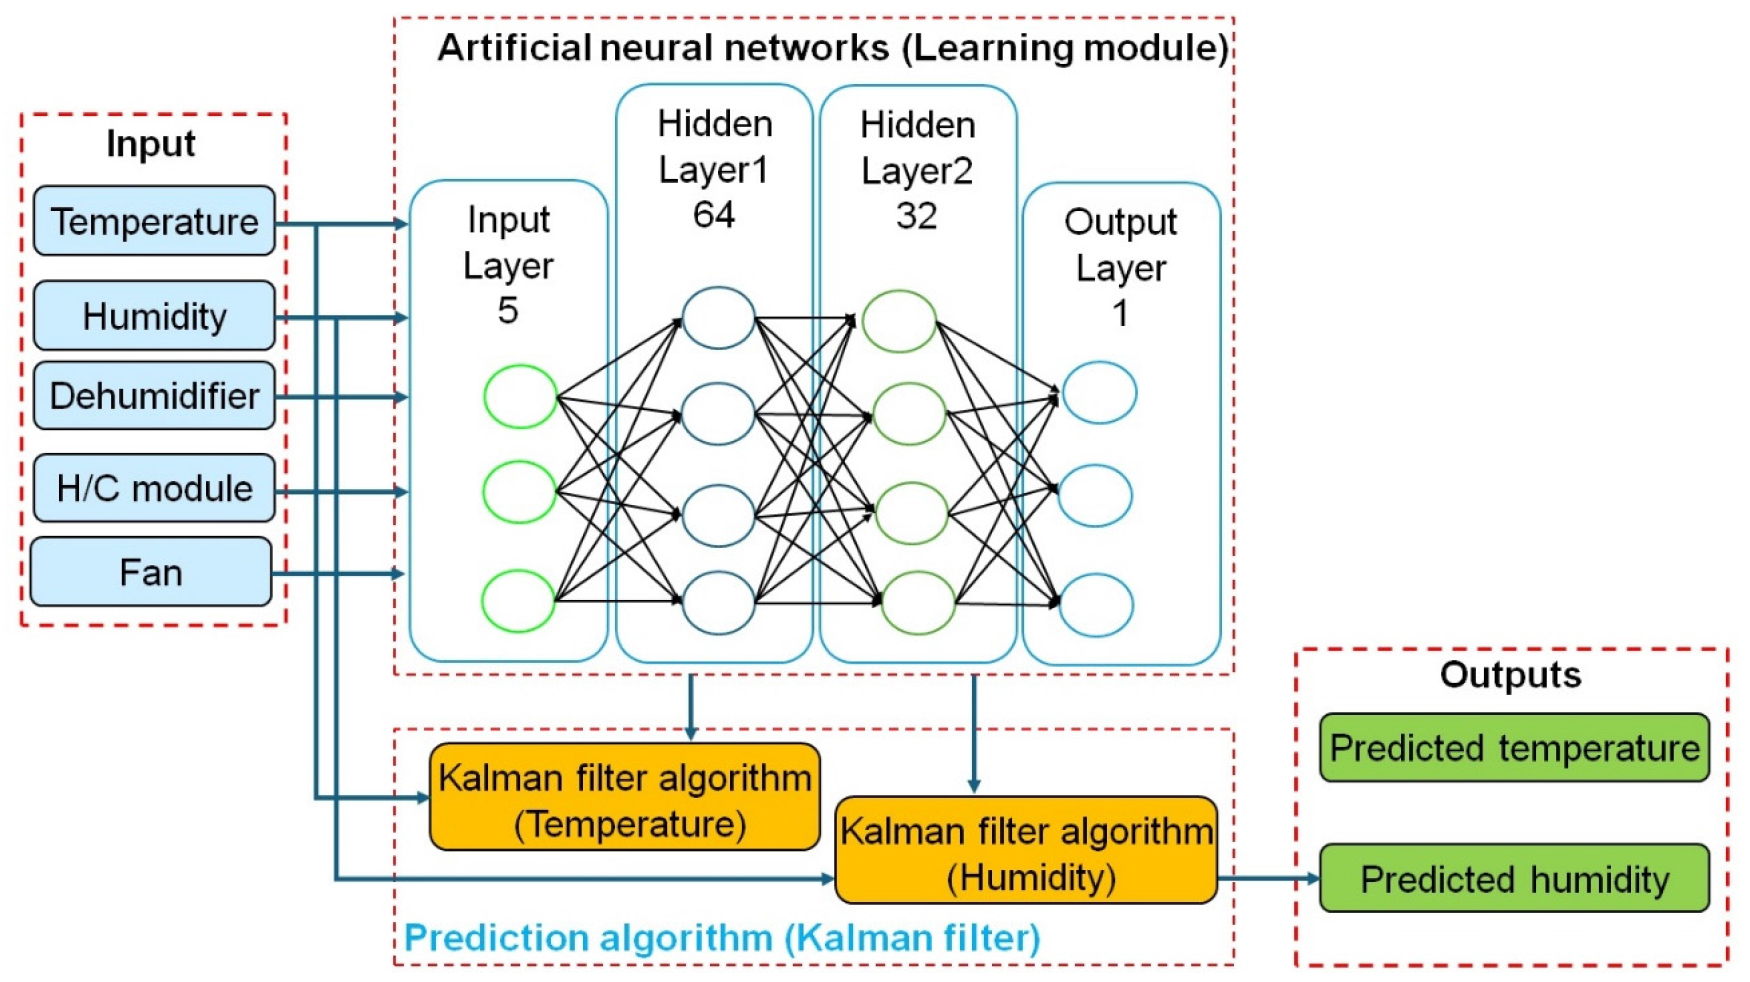
The ANN mapping is expressed as
Where, x(t) denotes the sliding-window input vector at time t and = {W1, W2, W3, b1, b2, b3} represents the set of trainable network parameters. Wk and bk correspond to the weight matrices and bias vectors of the k-th layer, respectively, while h1 and h2 denote the activation outputs of the first and second hidden layers. The function indicates the rectified linear unit activation function used in the hidden layers to introduce non-linearity. Finally, represents the ANN-predicted temperature or humidity at the next step, forming the basis for node environmental state estimation.
Model parameters were optimized using the Adam optimizer by minimizing the mean squared error (MSE) loss. Early stopping based on validation loss was applied to prevent overfitting. A split between training and testing datasets was adopted to preserve temporal causality and avoid information leakage, as illustrated in Fig. 4.
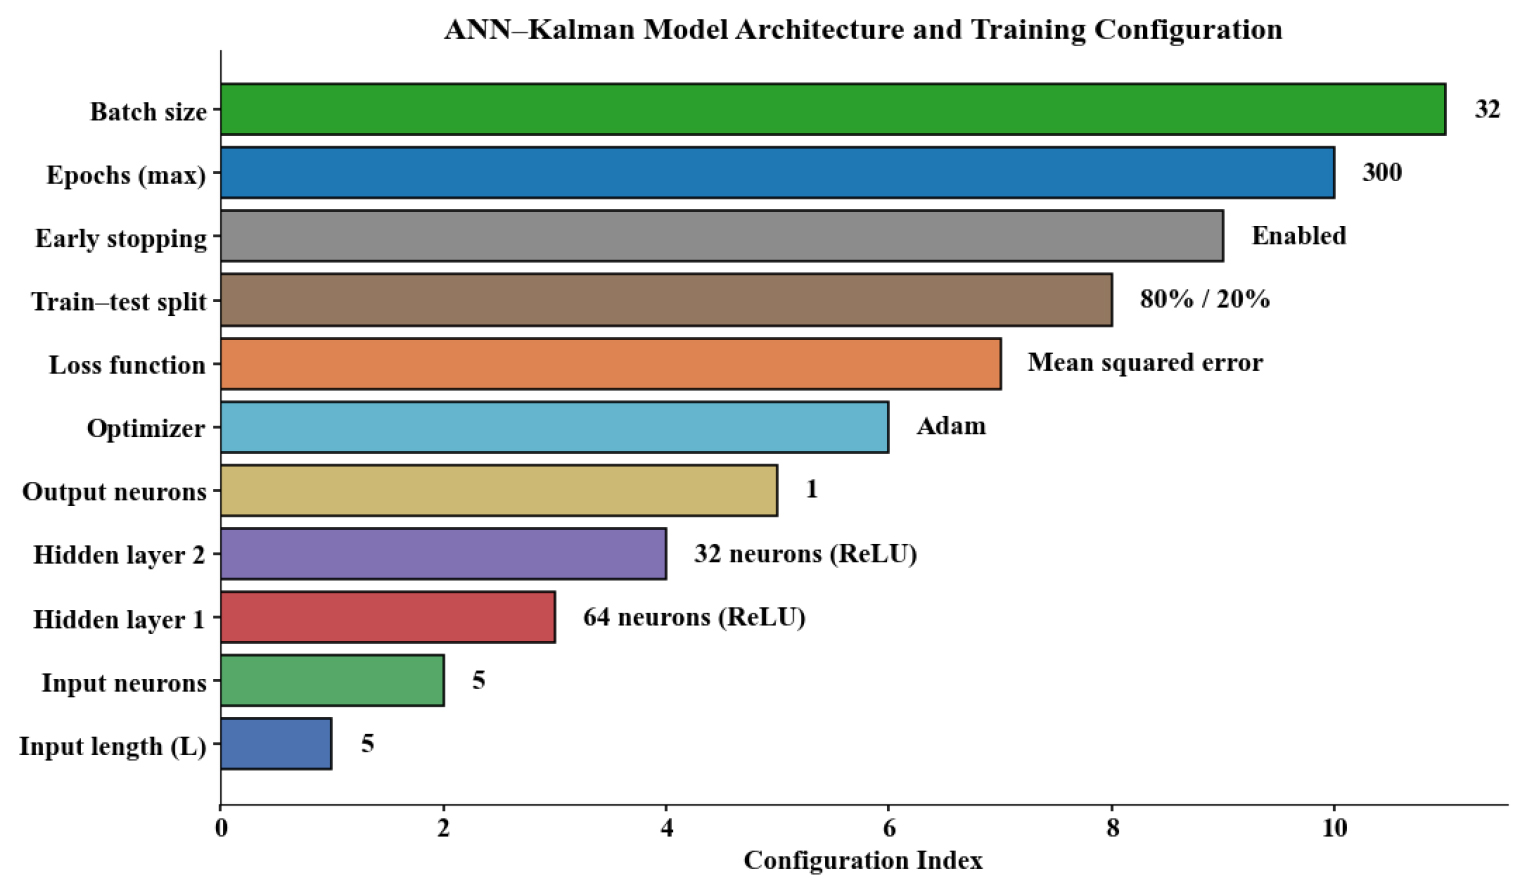
Model training was performed using the Adam optimizer with an initial learning rate of 0.001 and a batch size of 32 to ensure stable gradient convergence. The maximum number of training epochs was set at 300. Early stopping was implemented with a patience parameter of 20 epochs based on validation loss monitoring, and the model weights corresponding to the minimum validation loss were retained.
Time-series data were divided chronologically into training and testing subsets (70%-30%) without random shuffling to preserve temporal causality and prevent information leakage. The sliding-window length (L = 5) was selected based on empirical evaluation of prediction stability during repeated ventilation ON-OFF cycles, balancing short-term memory representation and computational efficiency.
To enhance temporal consistency and suppress high-frequency fluctuations in ANN predictions during abrupt actuator transitions, a discrete Kalman filter was applied as a post-processing state estimator. The ANN one-step-ahead prediction was treated as the measurement input to the filter. The state-space model was formulated as: State equation: Measurement equation: , Where represents the estimated true environmental state, denotes the ANN output, and and represent process and measurement noise, respectively. The covariance matrices and were empirically tuned using validation data to balance responsiveness and smoothing performance. Larger values enhanced smoothing during ventilation switching, whereas larger values increased sensitivity to rapid environmental changes. The Kalman-filtered output was used as the final environmental state estimate. Final predictions were inversely transformed into physical units for interpretation of temporal response behavior. However, the quantitative performance metrics were calculated and presented on the normalized scale used for model training. Prediction errors were computed as:
Where, and denote the prediction error signals for temperature and humidity at the node and time , respectively. Here, and represent the measured temperature and humidity, while and correspond to the values predicted by the ANN-Kalman model. These error terms quantify the instantaneous deviation between measured and predicted environmental states, used to evaluate prediction accuracy, stability, and temporal consistency at each sensor node.
Actuator control and analytical procedures
At each node , temperature, and humidity were recorded as discrete time series and . Spatial variability was quantified using instantaneous variance, which enabled characterization of airflow-induced heterogeneity during fan transitions. Transient environmental response rates were evaluated using first-order temporal gradients, as defined by
Where, and denote the temperature (°C) and relative humidity (%) measured at node at time ; represents the sensor node index; and denote instantaneous spatial averages across all nodes; represents spatial temperature variance; is the sampling interval; and and approximate the temporal rate of change of temperature and humidity, respectively.
To quantify cooling intensity and moisture redistribution immediately following actuator switching. Environmental data was transmitted by MQTT to the smartphone interface for visualization and control. Actuator execution was electrically verified by monitoring current and computing instantaneous power. Energy consumption during activation intervals was calculated as.
Where, denotes the supply voltage, represents the measured current at time , and is the instantaneous power consumption. The set corresponds to the time indices during which the actuator was in the ON state, is the sampling interval, and represents the total energy consumption during the activation period.
Experiments followed a baseline-activation-recovery protocol. After quasi-steady stabilization with the fan OFF, controlled ON-OFF cycles were applied to evaluate repeatability. Inter-cycle consistency was assessed using cycle-mean deviation. where denotes the number of ventilation cycles. For predictive evaluation, time-series data were chronologically partitioned into training and testing subsets.
Where, denotes the inter-cycle temperature deviation at node ; is the number of ventilation cycles; represents the mean temperature at node during cycle ; and is the overall mean temperature across cycles.
Performance evaluation procedure
Model performance at each node was quantitatively assessed using Root Mean Square Error (RMSE), Mean Absolute Error (MAE), and coefficient of determination (), mean bias error, and standard deviation of prediction error using Equations 15,16 and 17. In addition to conventional performance metrics, residual distributions were analyzed to assess prediction stability and noise suppression capability across nodes. The standard deviation of residual signals was used to quantify the smoothing effectiveness introduced by Kalman filtering during transient ventilation conditions.
Where, and denote the measured and predicted environmental variables (temperature or humidity) at node , respectively; is the prediction residual; is the number of evaluation samples; represents the mean measured value; and is the residual covariance matrix used to quantify noise suppression and prediction stability across spatial nodes.
Results
Environmental monitoring and control
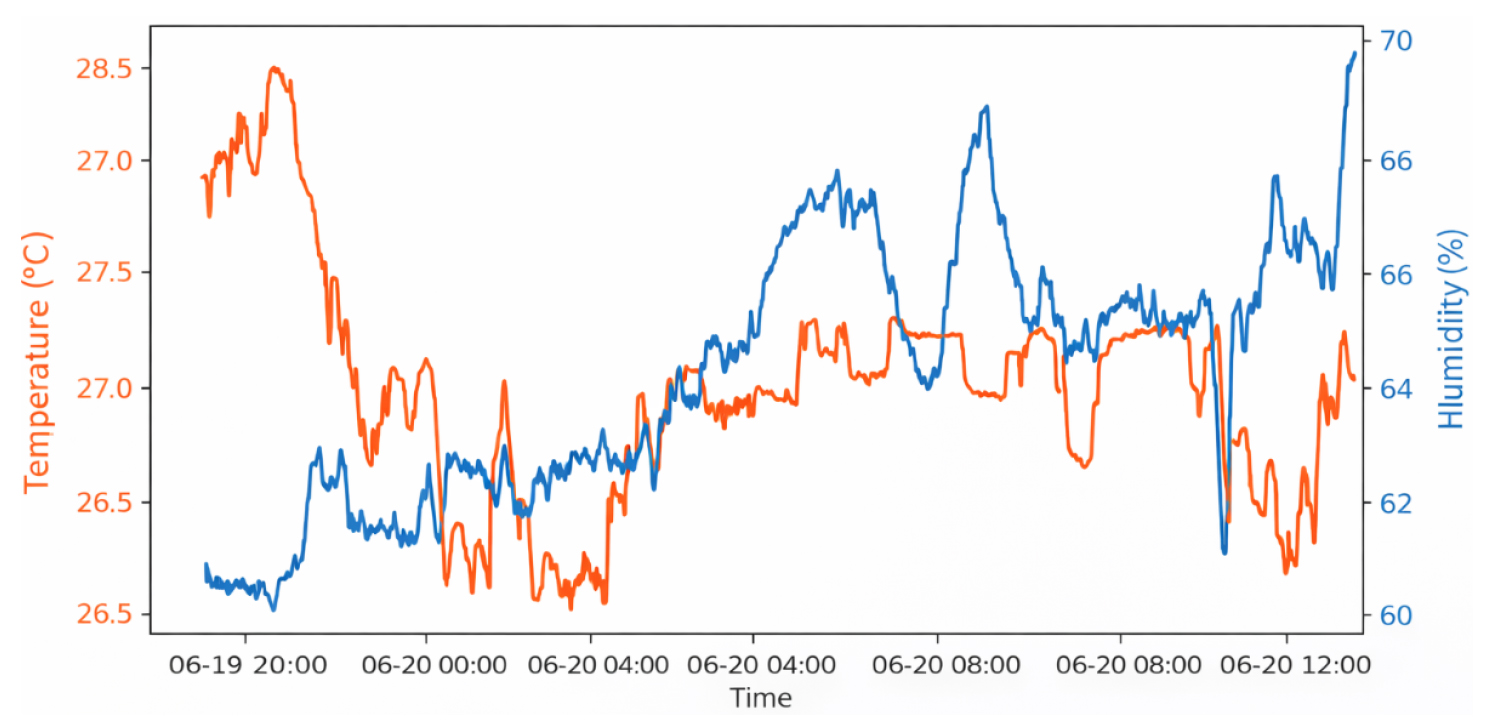
Controlled ventilation produced consistent and repeatable environmental transitions within the greenhouse simulator. Fan activation resulted in a rapid decrease in average air temperature, with reductions of approximately 0.8-1.8°C depending on initial conditions. After deactivation, temperature gradually recovered toward baseline without cumulative drift, indicating stable airflow propagation and reliable actuator execution across repeated cycles.
Relative humidity exhibited complementary behavior, increasing by approximately 3-8% during cooling phases and gradually stabilizing during recovery. Transient fluctuations were observed immediately after switching events, but no irregular oscillations or instability occurred.
The synchronized temperature-humidity response confirms that environmental variations were directly attributable to controlled ventilation, demonstrating repeatable system performance and validating the simulator as a reliable platform for actuator verification and predictive modeling.
Monitoring and control performance with the hybrid model
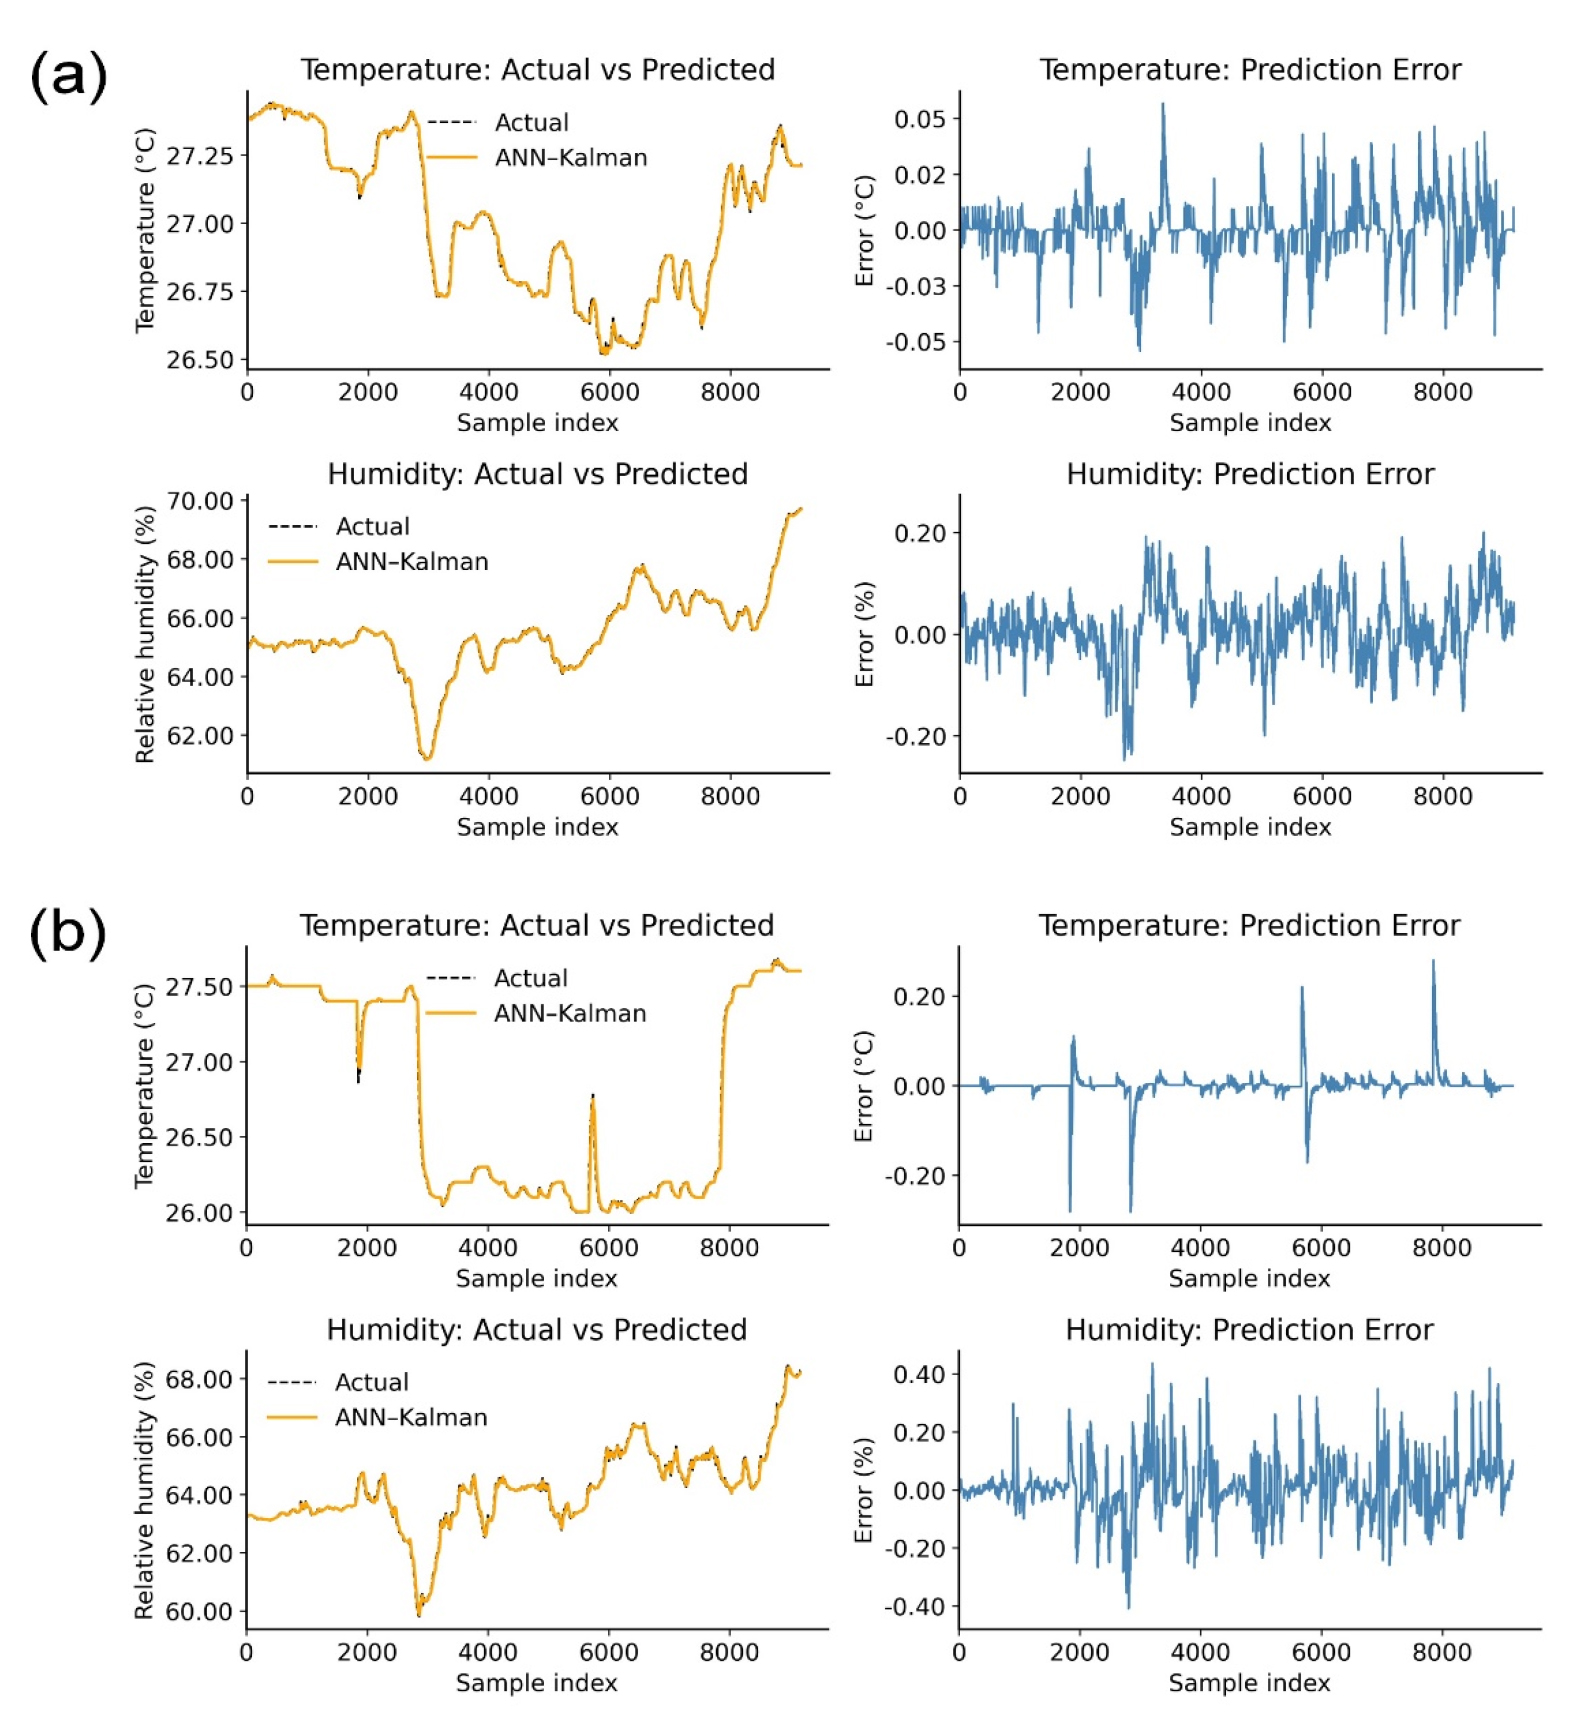
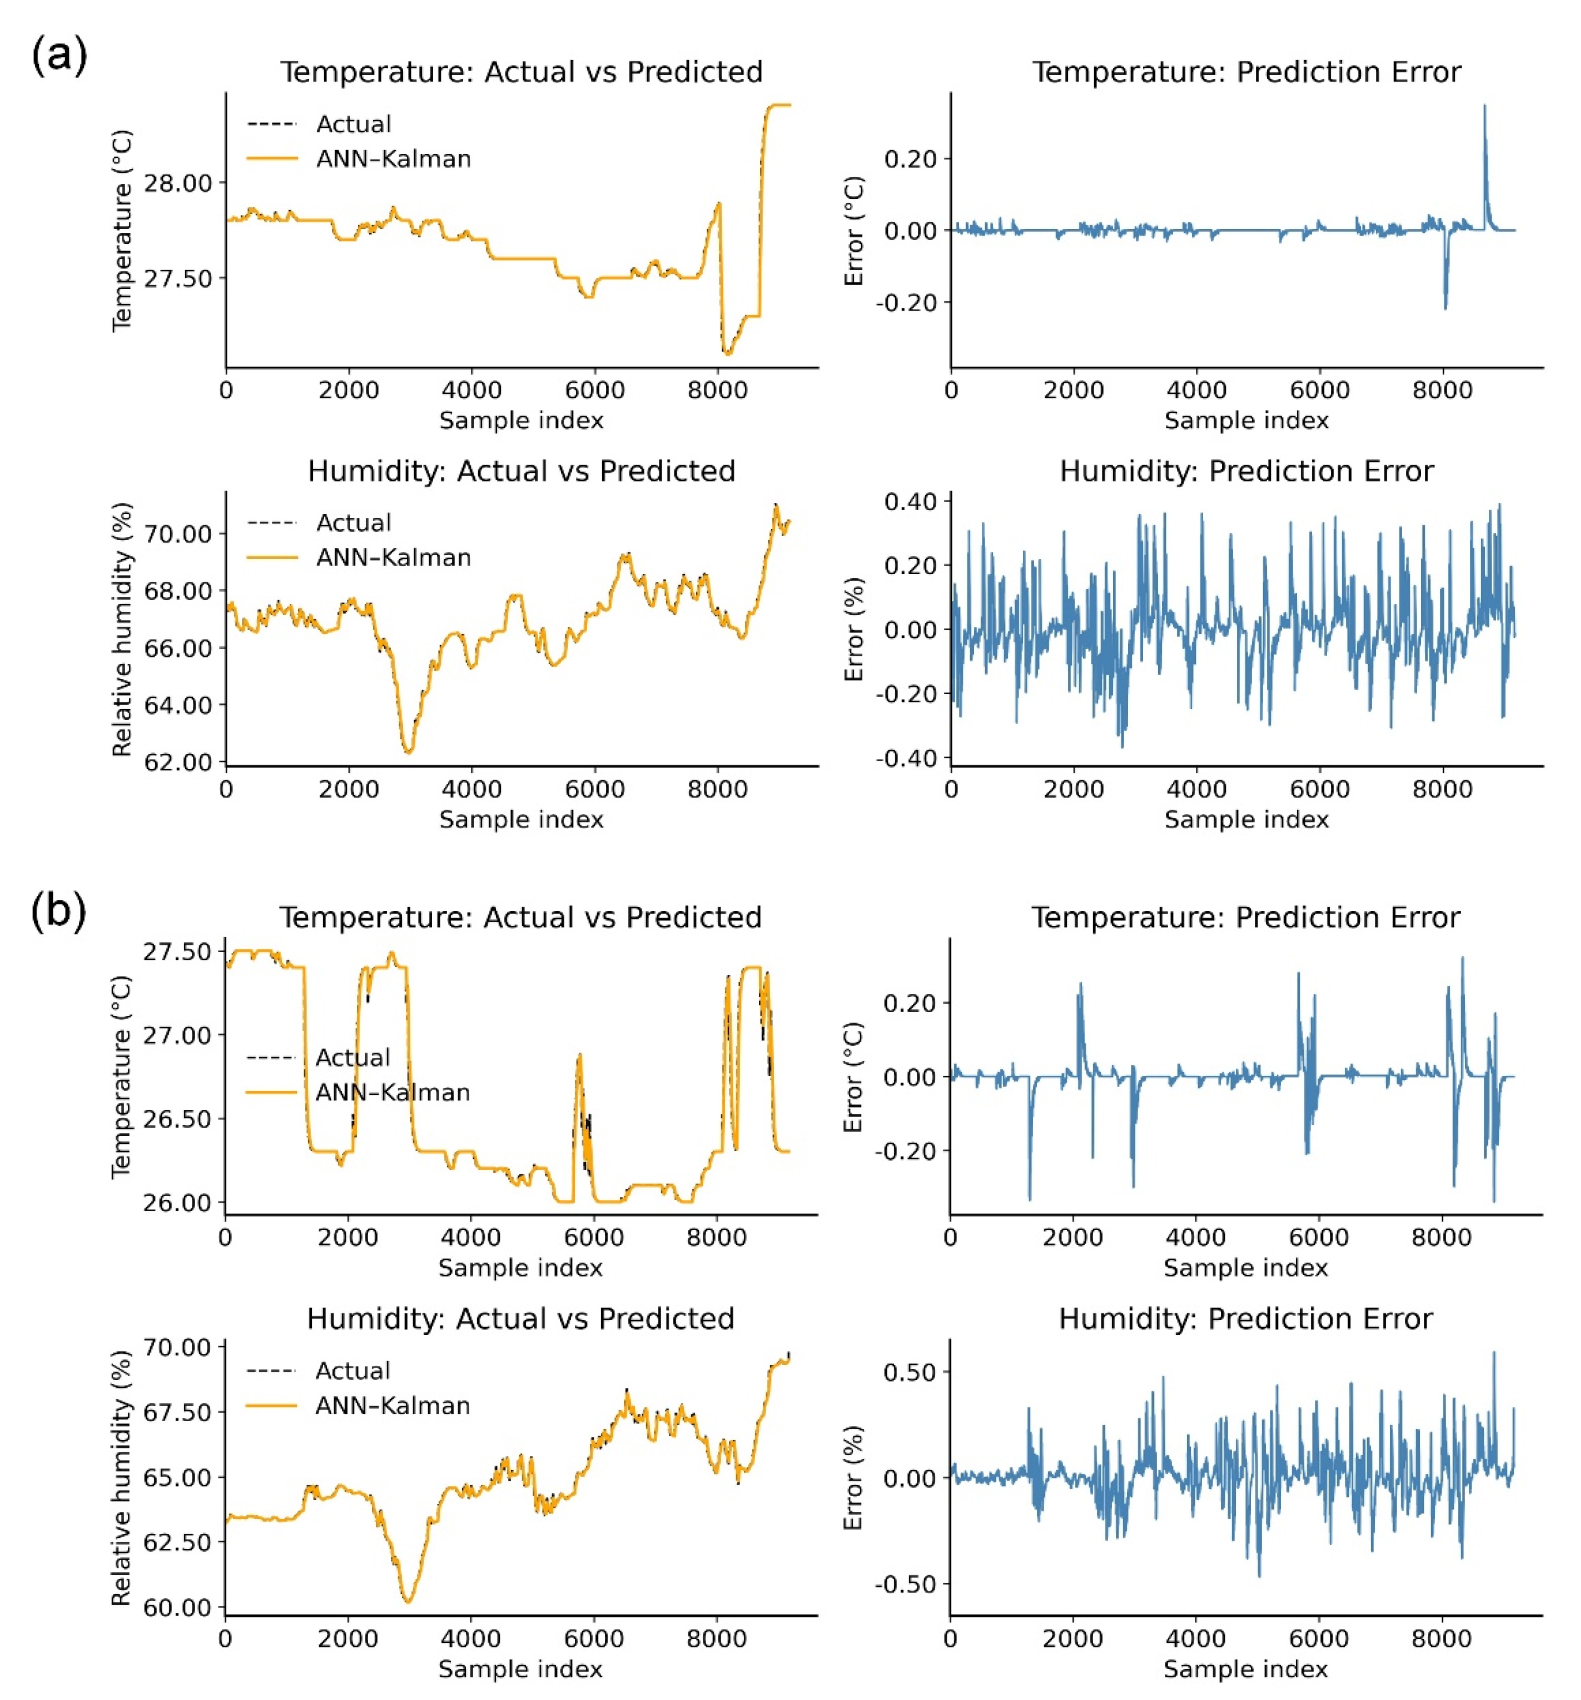
The proposed ANN-Kalman framework exhibited close agreement between measured and predicted temperature and relative humidity at both sensing nodes, maintaining stable tracking under steady-state and transient actuator conditions. At Sensing Node 1, temperature residuals were generally confined to ±0.3-0.5°C during steady operation, with brief peaks of approximately 0.8°C during abrupt fan transitions; these deviations rapidly converged without observable drift as shown in Fig. 6(a). Relative humidity errors were typically within ±2-3%, increasing temporarily to ~4% during rapid disturbances, with residuals remaining centered near zero.
At Sensing Node 2, temperature errors were generally below 0.5°C, with short-duration spikes during sudden environmental changes. Relative humidity residuals remained mostly within ±3-5%, likely reflecting localized airflow and moisture gradients as shown in Fig. 6(b). The model maintained stable and unbiased predictive performance across nodes.
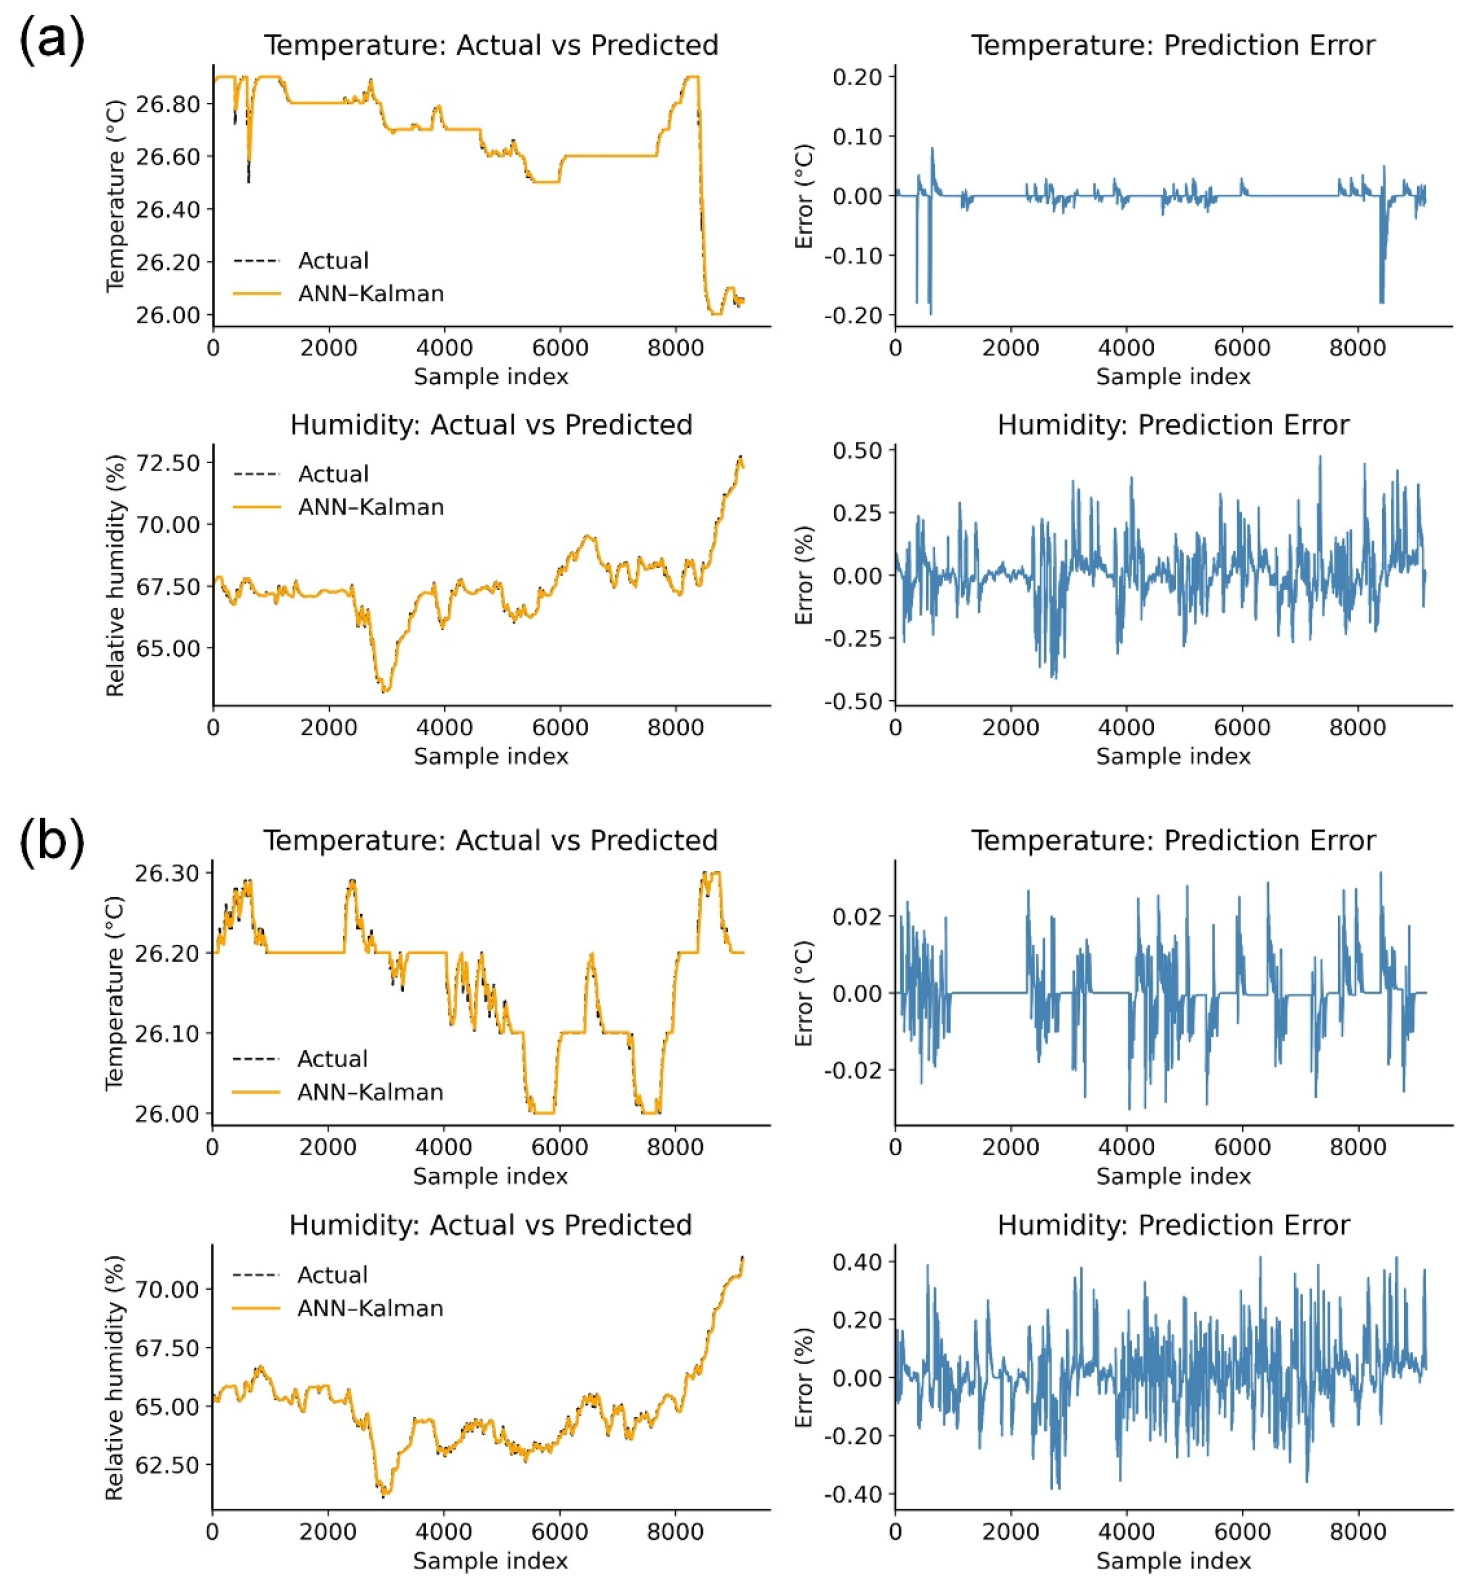
As shown in Fig. 7(a), sensing Node 3 showed stable predictive performance for both air temperature and relative humidity. Temperature residuals were predominantly within ±0.4°C, with brief negative excursions during abrupt transitions, particularly under rapid fan operation; these deviations were rapidly attenuated, indicating effective Kalman-based correction. Relative humidity errors were largely maintained within ±3%, exhibiting short-term variability without systematic bias or drift.
Sensing Node 4 exhibited slightly improved stability as shown in Fig. 7(b). Temperature deviations were typically within ±0.3°C, with residuals tightly centered around zero. Relative humidity errors generally remained within ±2-3%, with minor fluctuations under dynamic airflow conditions. These results confirm robust temporal tracking and noise suppression of the ANN-Kalman framework under spatially heterogeneous environmental dynamics.
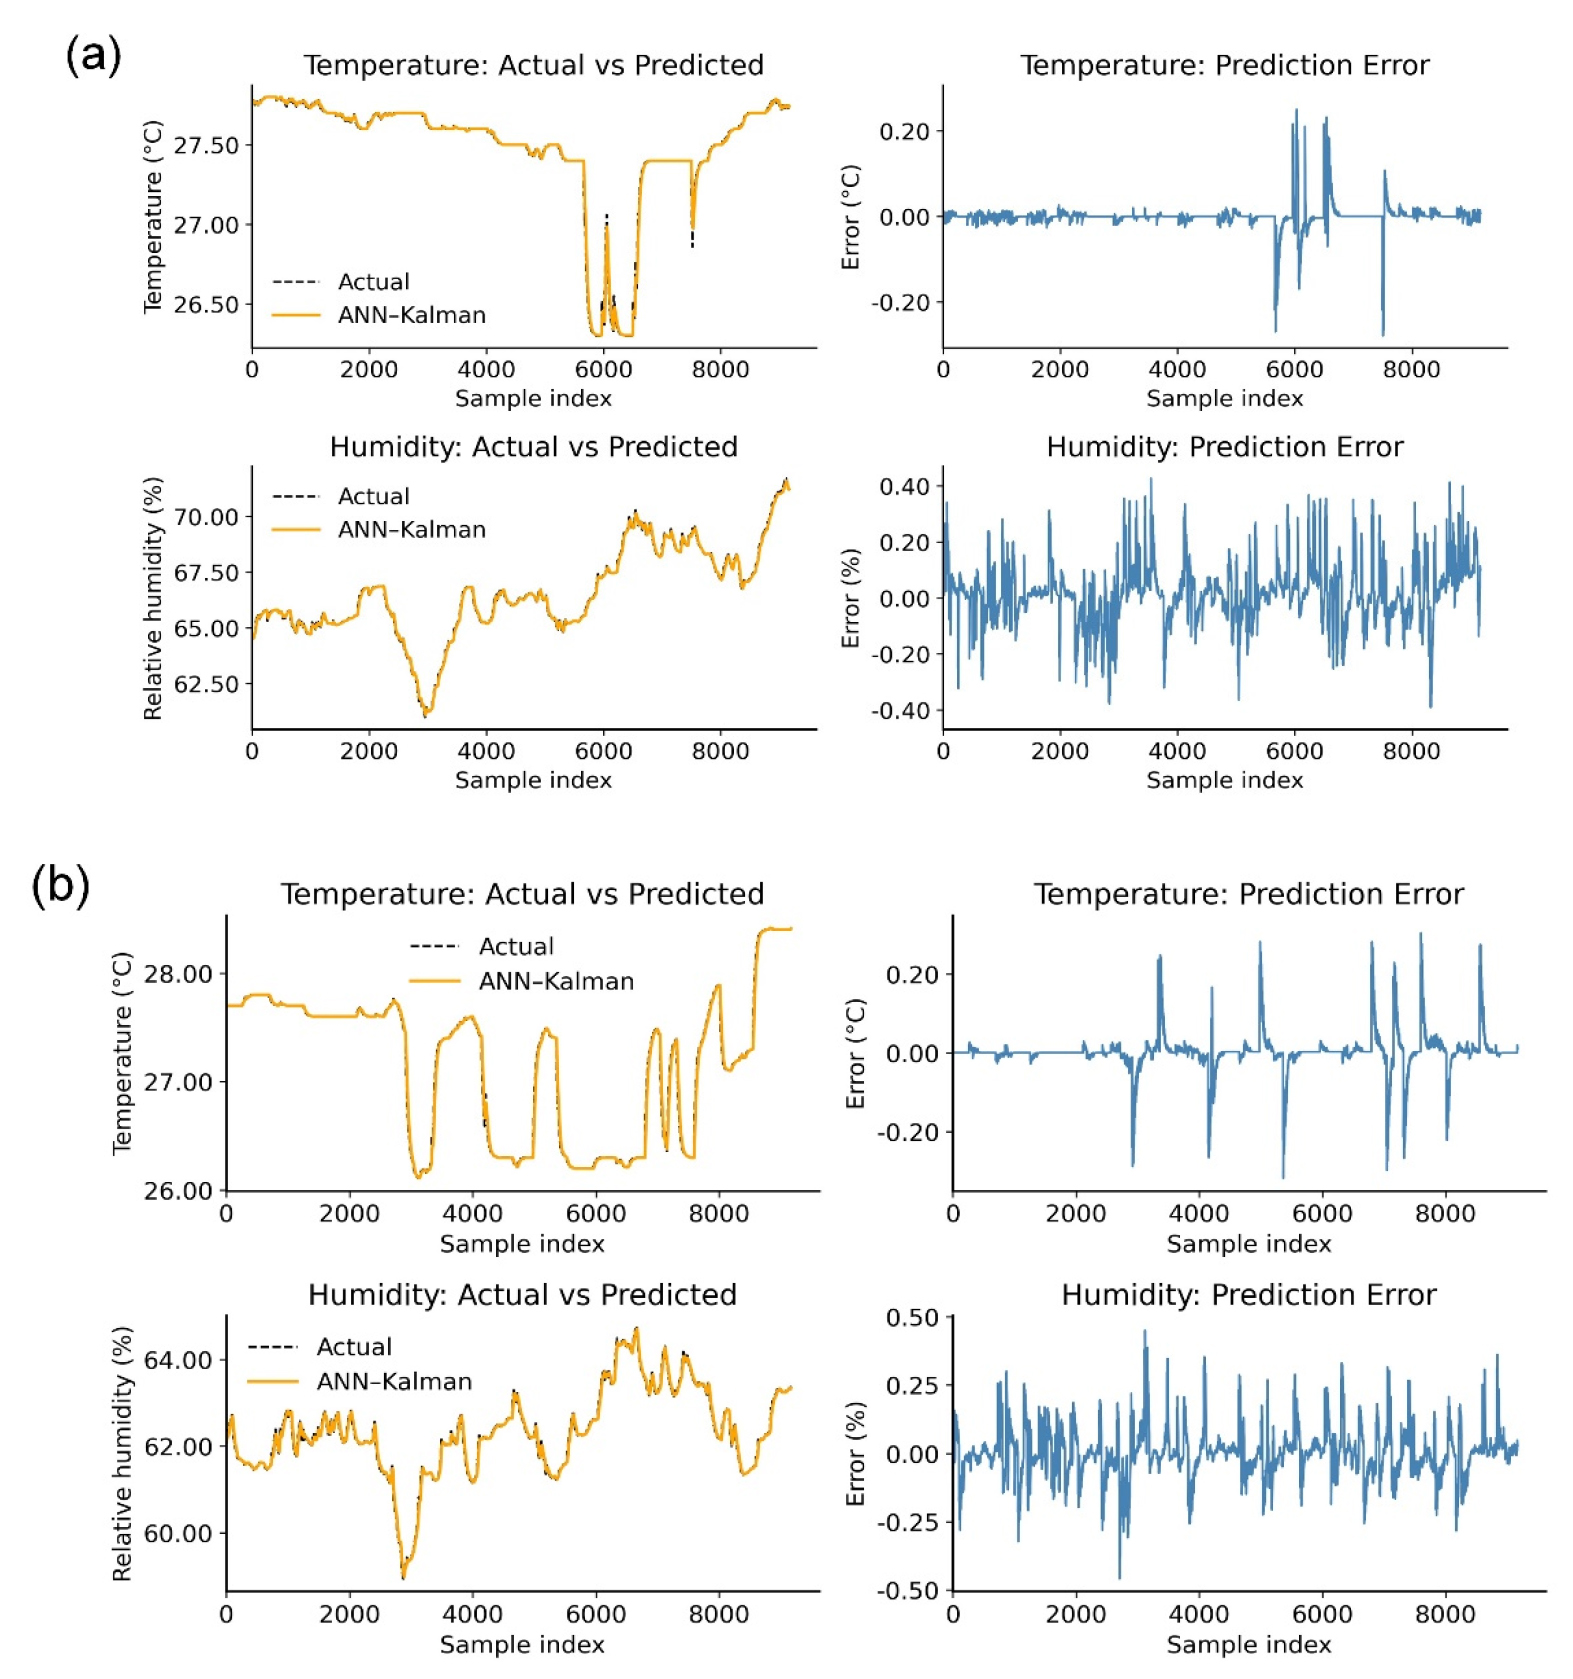
Sensing Node 5 experienced relatively stronger disturbances during repeated fan cycling as shown in Fig. 8(a), resulting in increased transient variability. Under steady conditions, the predicted temperature closely followed the measured profile; however, rapid cooling and heating phases produced short-duration error peaks approaching ±1.0°C, which quickly converged. Relative humidity residuals were more dispersed than those observed at upstream nodes, generally remaining within ±5% and exhibiting larger fluctuations during abrupt airflow redistribution. No persistent bias or drift was detected for either variable. Sensing Node 6 showed more pronounced short-term temperature oscillations during fan activation and shutdown as shown in Fig. 8(a). Transient temperature errors reached approximately ±1.2°C, during sharp transitions, but were rapidly suppressed, with steady-state residuals typically within ±0.5°C. Relative humidity errors were predominantly within ±3-5%. The ANN-Kalman framework maintained stable convergence and bounded errors under intensified dynamic conditions.
Sensing Node 7 maintained consistent temperature prediction performance as shown in Fig. 9(a), with residuals predominantly within ±0.4°C and no evidence of long-term bias. Short-duration deviations occurred during abrupt operational changes but were rapidly attenuated. Relative humidity predictions exhibited comparatively higher variability, with errors generally within ±4–6%, suggesting increased sensitivity to localized airflow redistribution.
Sensing Node 8 also demonstrated reliable trend tracking across repeated fan cycles as shown in Fig. 9(b). Temperature residuals were typically within ±0.5°C, with brief spikes during rapid transitions. Relative humidity errors occasionally reached ±5-6% during sharp environmental shifts but stabilized quickly thereafter. Both nodes confirm stable convergence and robust dynamic tracking of the ANN-Kalman framework under transient conditions.
Across Nodes 1-8, the ANN-Kalman framework maintained bounded and spatially consistent prediction errors, with temperature residuals typically within 0.3-0.8°C and relative humidity errors within 2-6%, depending on node location and exposure to airflow disturbances. The Kalman filter contributed substantially to suppressing high-frequency measurement noise and stabilizing ANN outputs during abrupt fan-induced transients. These results demonstrate the robustness and spatial reliability of the proposed method for multi-node greenhouse environmental prediction.
To assess robustness and spatial consistency of the proposed ANN–Kalman framework, prediction accuracy was quantitatively compared across all eight sensor nodes using multiple statistical indicators. Temperature and relative humidity were evaluated separately, and node-wise performance metrics were summarized.
For air temperature, as shown in Fig. 10, the ANN-Kalman model achieved consistently high accuracy across the network. The quantitative metrics summarized in Table 2 are presented on the normalized scale used during model training and evaluation. Across the eight sensing nodes, RMSE ranged from 0.002 to 0.015, while MAE ranged from 0.001 to 0.004. Nodes positioned closer to the ventilation fan or along dominant airflow paths exhibited marginally higher error values during abrupt fan ON/OFF transitions, reflecting stronger local thermal gradients. Nevertheless, the coefficient of determination remained uniformly high (R2 = 0.99-1.0), indicating strong agreement between measured and predicted temperature profiles. Mean bias values remained close to zero, with no systematic underestimation observed. All the quantitative performance results for temperature prediction are summarized in Table 2.
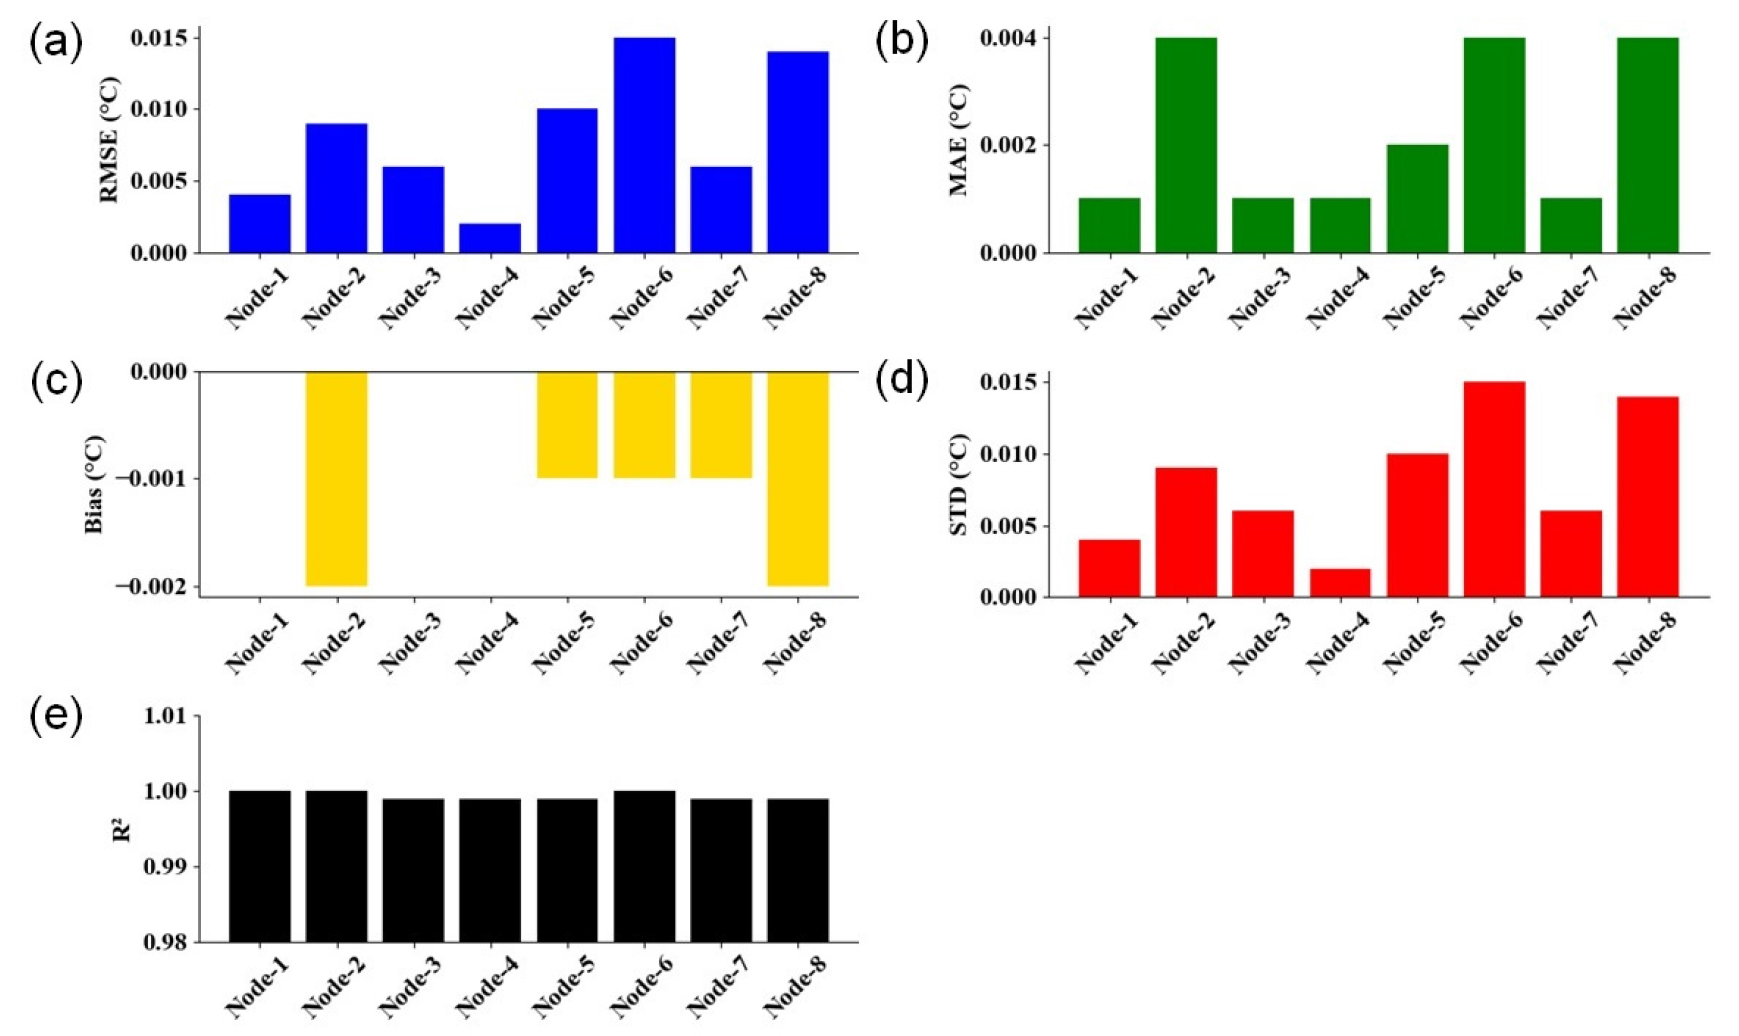
Table 2
Node-wise quantitative performance metrics for ANN-Kalman temperature prediction across eight sensing nodes.
For relative humidity, prediction errors were higher than those for temperature, as shown in Fig. 11, consistent with the greater complexity and spatiotemporal variability of moisture dynamics. The quantitative metrics summarized in Table 3 are also presented on the normalized scale used during model training and evaluation. Across Nodes 1-8, RMSE ranged from 0.014 to 0.042, and MAE ranged from 0.009 to 0.021. Nodes located along dominant airflow paths exhibited larger error values during rapid ventilation-driven humidity shifts. Despite these disturbances, the model maintained strong explanatory power at all nodes (R2 = 0.99-1.0). Mean bias values remained close to zero, indicating no persistent drift in the humidity predictions. All the quantitative performance results for relative humidity prediction are summarized in Table 3.
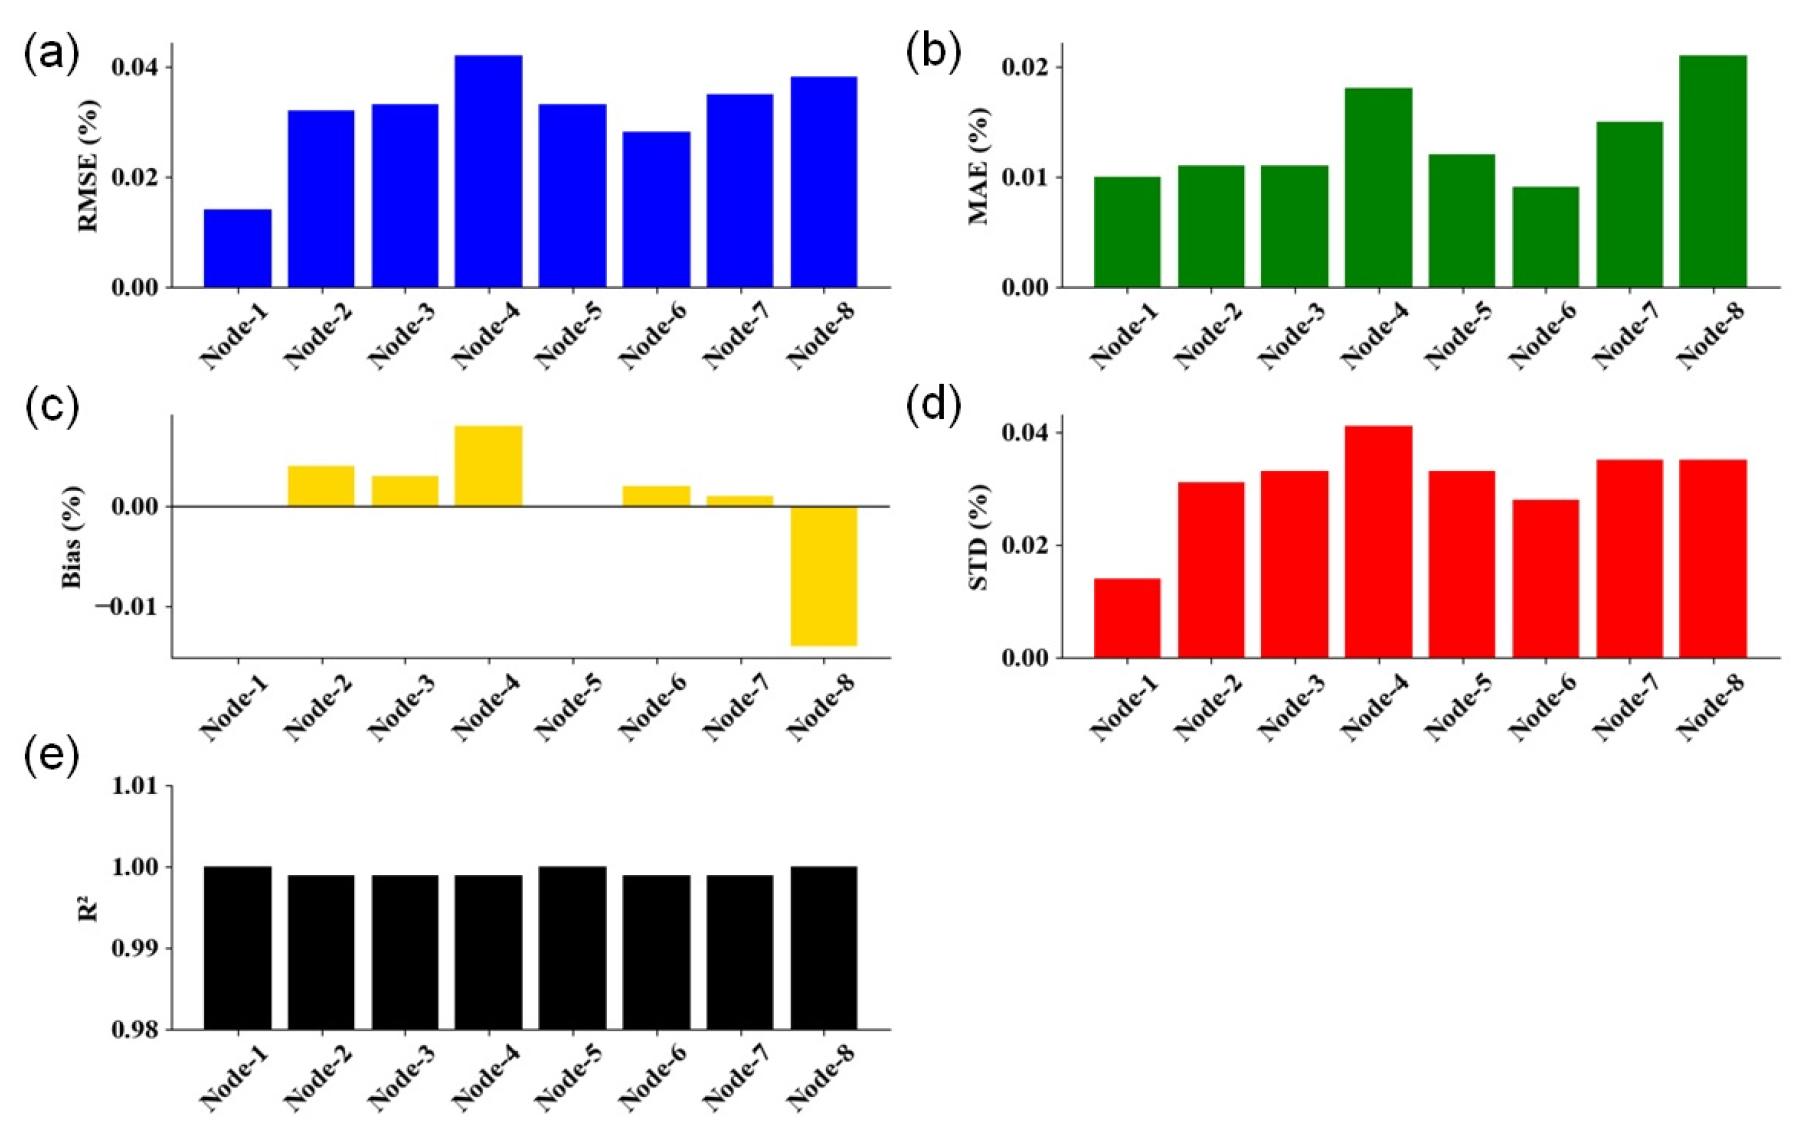
Table 3
Node-wise quantitative performance metrics for ANN–Kalman relative humidity prediction across eight sensing nodes (values expressed in physical units, %).
The residual standard deviation further demonstrates the stabilizing contribution of the Kalman filter. For temperature, the standard deviation of prediction errors was constrained to 0.002-0.015°C (Fig. 10(d)), whereas for relative humidity it ranged from 0.015 to 0.04% (Fig. 11(d)), depending on node location. These results indicate effective suppression of high-frequency fluctuations in the raw ANN outputs, particularly during fan-induced transient disturbances.
The multi-node evaluation confirms that the proposed ANN-Kalman framework delivers consistent and spatially robust prediction performance within the greenhouse simulator. Although minor node-dependent variations were observed due to localized airflow and environmental heterogeneity, inter-node differences in performance metrics remained limited. This supports the model’s generalization capability and its suitability for multi-node greenhouse monitoring and data-driven control applications.
Smartphone application features for monitoring and control
The smartphone application provided a real-time interface for visualizing raw environmental measurements and actuator operating states acquired from the greenhouse simulator as shown in Fig. 12. Temperature and relative humidity streams from all eight sensor nodes were displayed continuously in both numerical and time-series graphical formats, enabling direct observation of node-specific conditions without additional preprocessing. This interface supported monitoring of instantaneous values as well as short-term temporal trends during experiments.
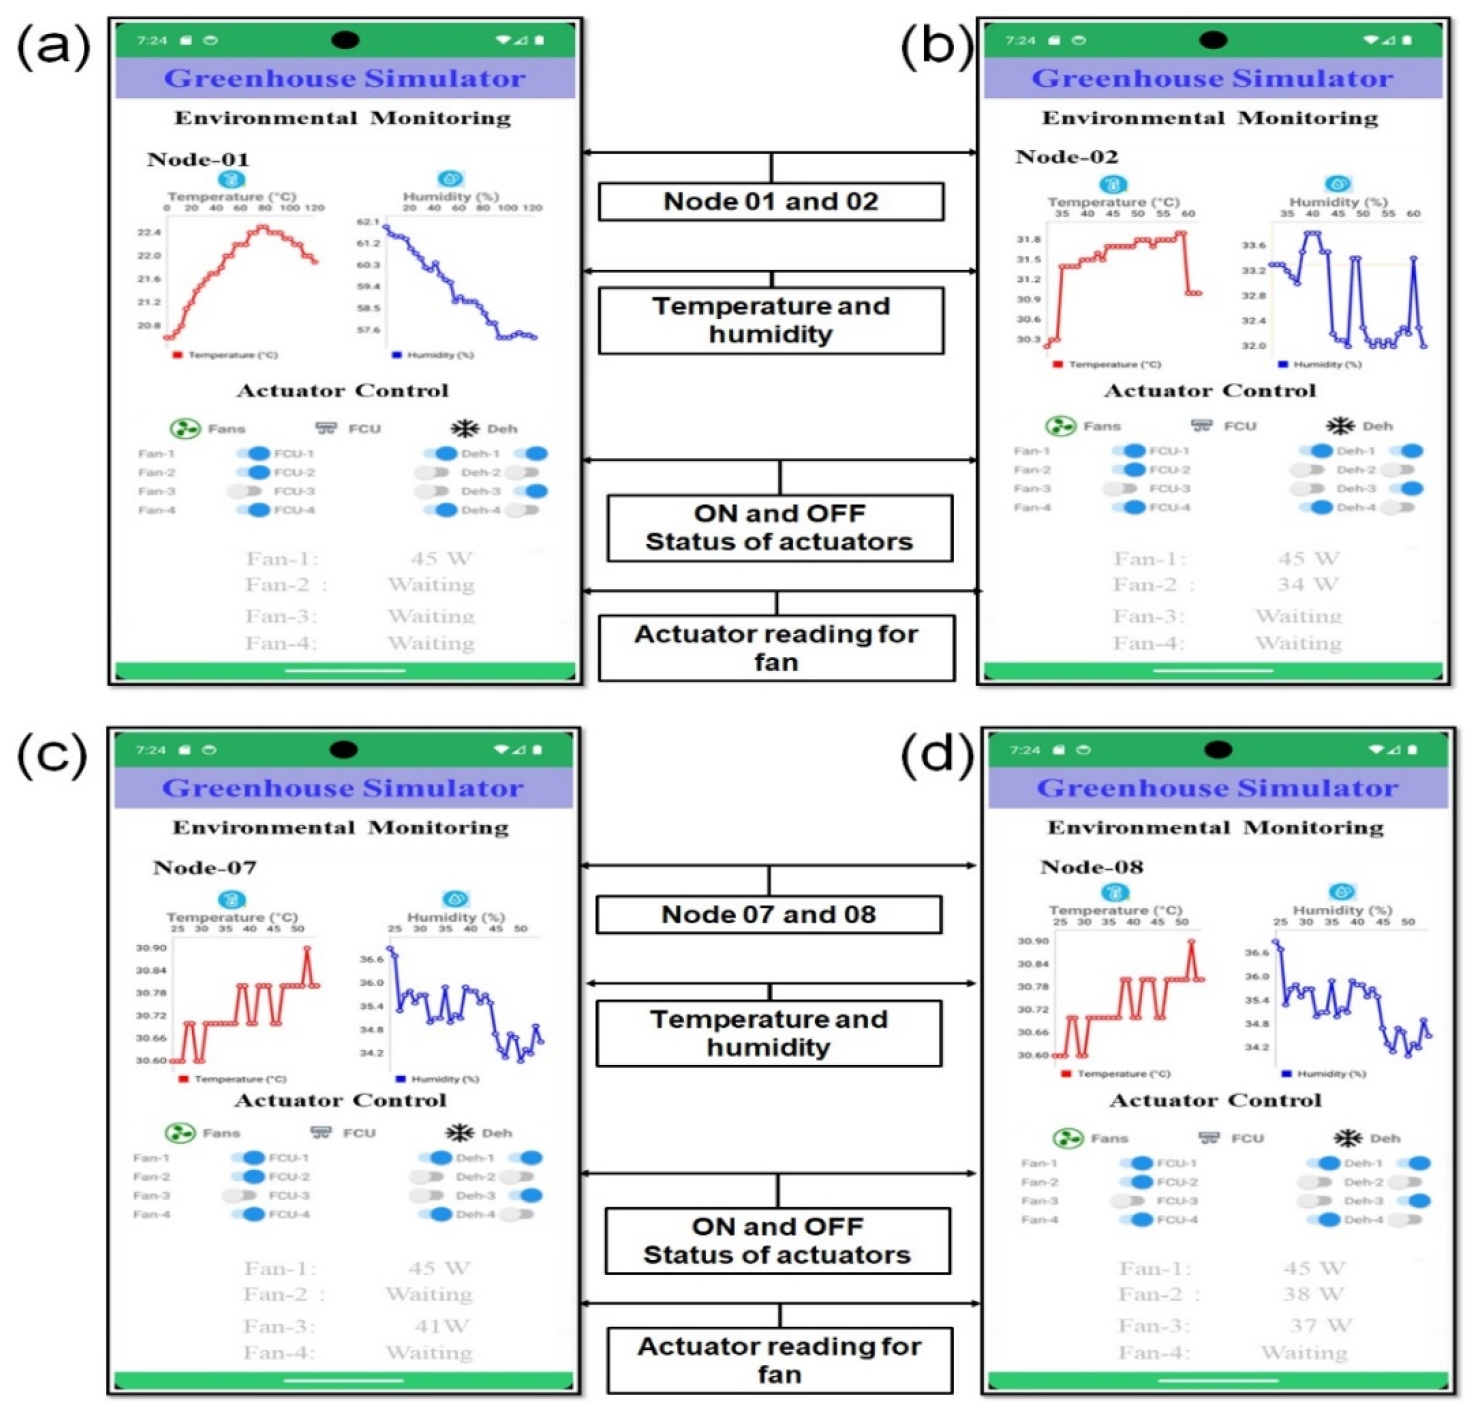
During ventilation fan ON/OFF transitions, the application captured the dynamic environmental responses across all nodes. Fan activation produced measurable temperature reductions and humidity fluctuations, followed by gradual stabilization after fan shutdown. Although the overall response pattern was consistent, small differences in response magnitude and timing were evident among nodes, reflecting spatially heterogeneous airflow within the enclosure. These raw-data visualizations facilitated rapid qualitative assessment of transient dynamics and direct node-to-node comparison.
The application also displayed real-time actuator information, including fan operating status and associated electrical signals (e.g., power consumption and current draw). Clear state-dependent changes enabled verification of actuator execution and confirmed correspondence between control commands and observed environmental responses. By integrating environmental monitoring and actuator status within a unified interface, the smartphone application served as an effective tool for real-time supervision and experimental validation in the greenhouse simulator.
Discussion
The proposed smartphone-application-enabled greenhouse monitoring system offers distinct advantages over conventional environmental monitoring and control, which often rely on single-point sensing and rule-based actuator operation. Such approaches have limited capability to resolve localized variability or to verify actuator execution in situ (Xu et al., 2024; Song et al., 2024). In contrast, the multi-node sensing configuration used here enabled direct observation of spatially differentiated temperature and humidity responses, including measurable inter-node differences during ventilation fan operation, consistent with reported greenhouse environmental heterogeneity (Kim et al., 2023). The controlled simulator setting further strengthened attribution of observed changes to actuator operation.
Smartphone-based greenhouse interfaces have been widely reported as practical tools for real-time monitoring and manual control (Cafuta et al., 2021; Van et al., 2019). However, many implementations emphasize visualization and basic control without systematic actuator verification or predictive analytics. The application developed in this study extends these functions by integrating raw node-level measurements with actuator status and signal visualization within a unified interface. In particular, power monitoring enabled direct verification of fan operation, addressing a limitation frequently noted in opportunistic and smartphone-based sensing systems regarding measurement reliability and interpretation (Nemati et al., 2017).
The hybrid ANN-Kalman prediction framework further differentiates the proposed system from data-driven greenhouse modeling approaches. Although ANNs can capture nonlinear dynamics, standalone models can be sensitive to measurement noise and abrupt actuator-induced transitions (Roh et al., 2024). By incorporating Kalman filtering, the proposed method achieved stable node-wise predictions, with temperature errors predominantly within 0.3-0.8°C and humidity errors within 2-6% across the network, with minimal bias and limited inter-node variability despite localized airflow effects.
The simulator-based evaluation is an additional contribution because field-based greenhouse assessments are inherently affected by weather fluctuations and external disturbances, which hinder reproducibility and complicate isolation of actuator effects (Xu et al., 2024a). The controlled enclosure enabled repeatable testing under predefined conditions, facilitating robust evaluation of monitoring, visualization, verification, and prediction performance prior to deployment.
The proposed ANN–Kalman framework was designed for short-term prediction of immediate environmental responses to actuator operation, with a sliding window (L = 5) selected to capture rapid transient dynamics during fan-induced events. Although this configuration proved effective for short-horizon estimation, its performance for daily or multi-day prediction may not remain consistent, because longer-term greenhouse climate dynamics are governed by more complex factors such as diurnal solar radiation, external weather variability, seasonal shifts, crop transpiration, and canopy development. Therefore, long-term forecasting would require retraining with longer temporal sequences, additional environmental and biological inputs, and data collected under different seasons and crop growth stages, together with seasonal recalibration or adaptive updating.
In addition, while the present study focused on physical environmental variables and actuator power signals, the framework can be extended toward crop-centered closed-loop control by incorporating physiological indicators such as leaf or canopy temperature, transpiration response, and growth-related traits. Such integration would enable control decisions to be evaluated not only by their effect on greenhouse climate but also by their impact on crop condition. Moreover, practical deployment in commercial greenhouses will require tuning of the Kalman filter covariance matrices (Q and R) to account for higher stochastic variability, sensor noise, and spatial heterogeneity.
Overall, the proposed framework integrates multi-node sensing, smartphone-based monitoring, actuator verification, and ANN-Kalman prediction within a repeatable simulator environment. Compared with existing greenhouse monitoring technologies, this integration improves reliability, interpretability, and scalability, supporting its potential for precision greenhouse management and data-driven environmental control.
Conclusion
This study developed and validated a smartphone-application-enabled greenhouse simulator that integrates multi-node environmental sensing, actuator verification, and a hybrid ANN–Kalman prediction framework. The platform enabled real-time visualization and control of environmental and actuator data from eight spatially distributed sensor nodes. Under controlled fan-cycling experiments, the simulator generated repeatable environmental responses, with temperature changes of approximately 1.0–2.0°C and relative humidity variations of 4–8% following fan activation. Simultaneous power monitoring confirmed reliable actuator execution, with fan current remaining below 1.0 A, thereby enabling clear association between commanded actuator operation and the observed environmental response.
The ANN-Kalman model achieved high prediction accuracy and spatially consistent performance across all nodes. For temperature, RMSE remained below 0.02 on the normalized scale and R2 exceeded 0.99 at all locations, indicating close agreement between measured and predicted signals. For relative humidity, RMSE remained below 0.05 on the normalized scale, with similarly high R2 and negligible bias, demonstrating stable performance despite localized airflow-driven variability. In addition, the Kalman filter effectively attenuated high-frequency fluctuations during fan ON/OFF transitions, improving the temporal smoothness and stability of the ANN-based predictions.
Beyond its predictive performance, the proposed framework has broader significance for intelligent greenhouse management. By integrating environmental prediction with power-based actuator verification, the system establishes a stronger link between sensed conditions, estimated environmental response, and actual control execution. This capability is particularly relevant for the realization of closed-loop greenhouse control, in which control actions must be continuously assessed not only by predicted environmental outcomes but also by confirmed actuator operation. Furthermore, the proposed framework provides an important foundation for digital twin implementation by enabling near-real-time synchronization between virtual system states and physical greenhouse behavior. Such integration may support advanced functions including fault detection, predictive control, adaptive decision-making, and operational optimization. Therefore, this study contributes not only a validated greenhouse simulation and prediction platform, but also a practical step toward autonomous, data-driven, and digitally integrated precision agriculture systems.
