

Introduction
Materials and Methods
Testing apparatus
Materials for experiments
Experiment methods
Results and Discussion
Characteristics of fluidization
Fluidization start-up velocity
Terminal velocity
Summary and Conclusion
Introduction
With labor population decreases and aging phenomena (increased in the aged farmers older than age 65-year) in the villages, a custom work by machineries rental is becoming a generalized trend in the farming. Accordingly, farm machineries are also becoming larger and of high performance in Korea, China and Japan (Kutzbach, 2000).
One of the important parameters to evaluate the performance of the combine harvester is a separation capability (Zhan et al., 2011). During separation work by combine harvesters, the separation by pneumatic force and specific gravity are simultaneously executed (Lee, 2011; Sosulski, 1987; Sosulski et al., 1987). The separation unit in combine harvester is comprised of two devices of pneumatic separation by air and oscillatory sorting separation by gravity (Kim et al., 1994; Srivastava et al., 2006; Kim et al., 1984). Among these, the pneumatic separation is a method to forcefully separate grains and foreign materials by air. When grains are vibrated to separate the grains and other foreign materials, it is important to maintain the air velocity adequately (Gebrehiwot et al., 2008). If adequate air velocity is not maintained, it may lead income reduction for the farms due to separation defect or grain losses. Therefore, it is important to observe and analyze the behavior of the separation subjects such as grains and chaffs during pneumatic separation process (Hollatz and Quick, 2003). For that, it is needed to make grain fluidized. Also, it is required to investigate the start-up velocity required for the fluidization of grains and limit air velocity to prevent grains disperse.
In the fluidization process, air flow is fed into the grain bed to make grain body flowing-state just like a liquid. Fluidization has been already implemented in the chemistry field and is being used in the drying, reaction, and transportation processes (Umeda, 1971; Suyama and Shimizu, 1980; Lee, 2006). However, fluidization has been applied mostly for the micro-solid, therefore, attention to the relatively large particles like grain has languished in a state of not exploitation with few cases. When grain is stacked on the compact porous distributor like metal net or cloth and air is fed from its bottom, if the air velocity is low, it is flowing through grains and then goes out, but grains won’t be moved (fixed bed). Fixed bed is the state of pneumatic drying. However, when the air velocity becomes higher, grain started moving violently just like that of water boiling. This violent movement-state is called as fluidized bed. With further increases of air velocity, grains would be dispersed by the air (transfer bed) which is an air transfer-state (Zhao et al., 1999; Srivastava et al., 1990). That is, fluidized bed is an intermediary-state between fixed bed and transfer bed. However, even in the same fluidized bed, grain flowing would be changed by air velocity and other factors.
Son et al. (2008) has analyzed the characteristics of minimum fluidization velocity and pressure fluctuations in the annular fluidization bed reactor. They reported that the minimum fluidization velocity of flowing particles was increased with increases in the size of the fluidized particles. Suyama et al. (1980) estimated the average flying velocity of the single grain in the vertical tube and the terminal velocity for three axes directions. They reported that the measured average terminal velocity of grain was in a range of 6.1~8.4 m/s. Umeda (1971) has fluidized beans, pulses, rice, unpolished rice, and rapeseeds by air during the fluidization processing of grains and investigated the start-up air velocity. They reported that the start-up air velocity was 0.6~1.7 m/s and the air velocity was increased as the average diameter of rapeseeds was increased. Nonami et al. (2002) has measured the maximum terminal velocity of the chaff 2.3 m/s and minimum terminal velocity of the rice 6.5 m/s in the flow mobility analysis of the grain and chaff inside the vertical tube. They proposed that the adequate air velocity for the grain separation was 2.3~6.5 m/s based on the measurement results. Eissa (2009) determined porosity, rupture strength and terminal velocity of flaxseed in order to obtain satisfactory values of separation efficient with minimum losses at suitable levels of feeding rate, and moisture content of mixture. Nahal et al. (2013) also has evaluated the influence of some effective parameters on terminal velocity in order to apply the results for the design of equipment for separation of different particles of the shelled walnuts. However, the researches performed so far have focused on the grain types and its size.
The grain moisture contents and feed are changed depending on the crop situation during harvest, working condition such as crop falling, and working place. Besides, the thickness of the grain bed is changed depend on the position at front and back of the grain screen inside the combine harvester. Therefore, investigations about the grain moisture and flow changes have been lacked in the existing researches.
Therefore, the characteristics of grain flow inside the vertical duct according to the grain types, fluidization of grain, and moisture contents changes were observed in this study. In addition, the starting wind velocity and the terminal velocity for the fluidization were estimated by measuring the air velocity and static pressure drop. The ranges of start-up wind velocity and terminal velocity were proposed to improve separation performance of the combine harvester through mutual comparison.
Materials and Methods
Testing apparatus
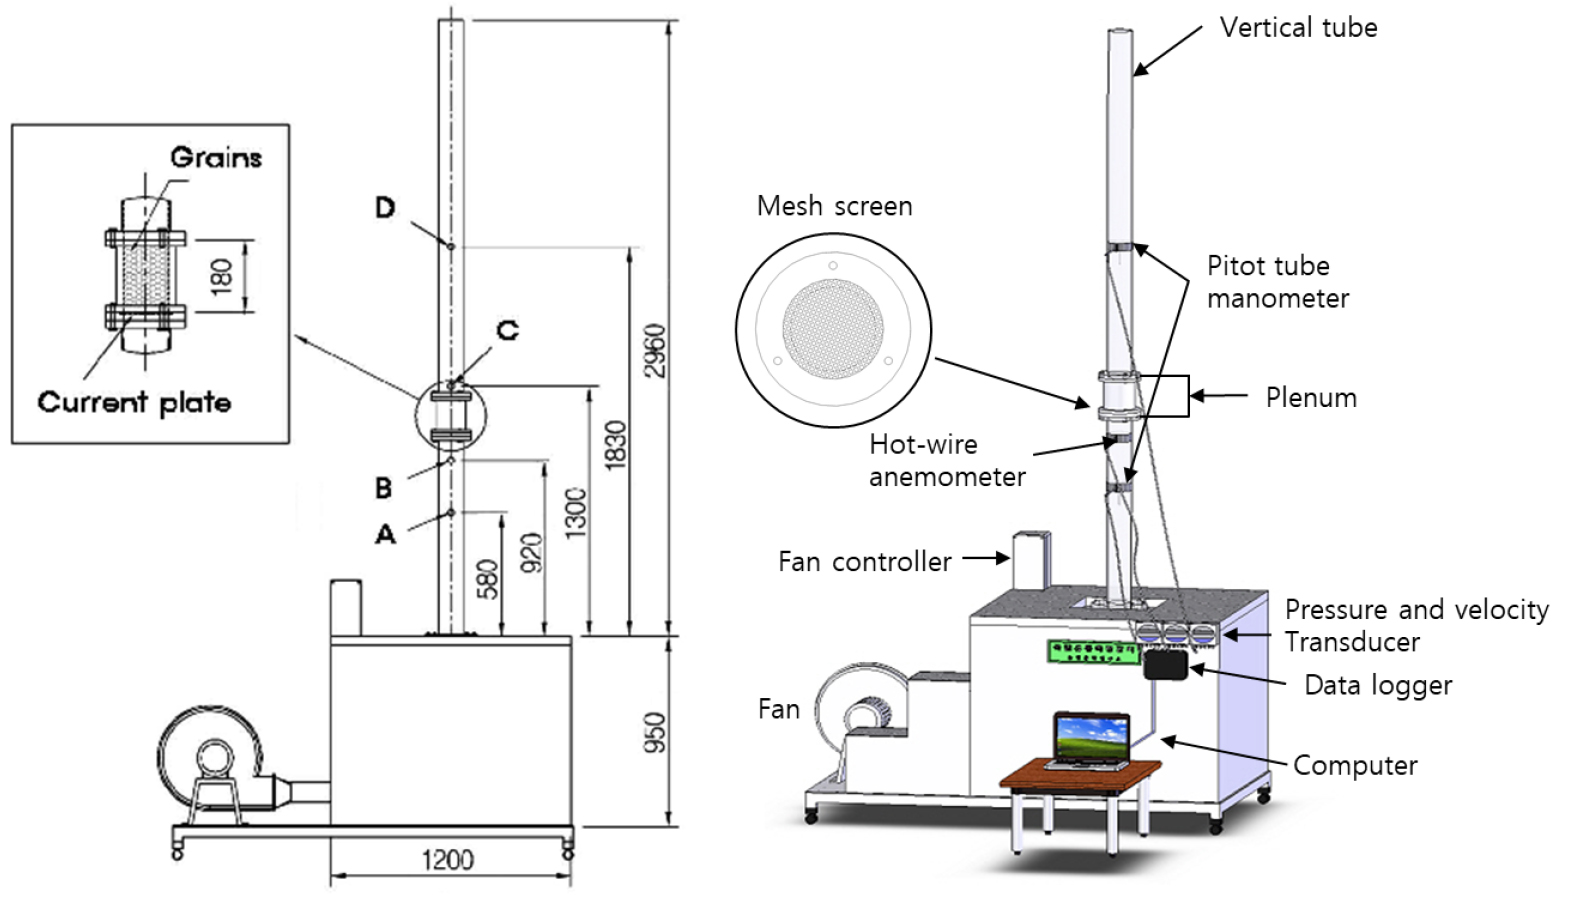
The vertical wind tunnel was designed to analyze the characteristics of grain flow depending on the grain types, fluidization of grains, and moisture contents of grains. The vertical wind tunnel comprised of fan, fan controller, plenum, vertical tube, and data logger as shown in Fig. 1. High pressure fan with 3kW of capacity (DTB-3803, Dongkun Industrial Co., Ltd.) was used as a fan unit. For the vertical tube, a transparent acrylic pipe with diameter 112 mm was used.
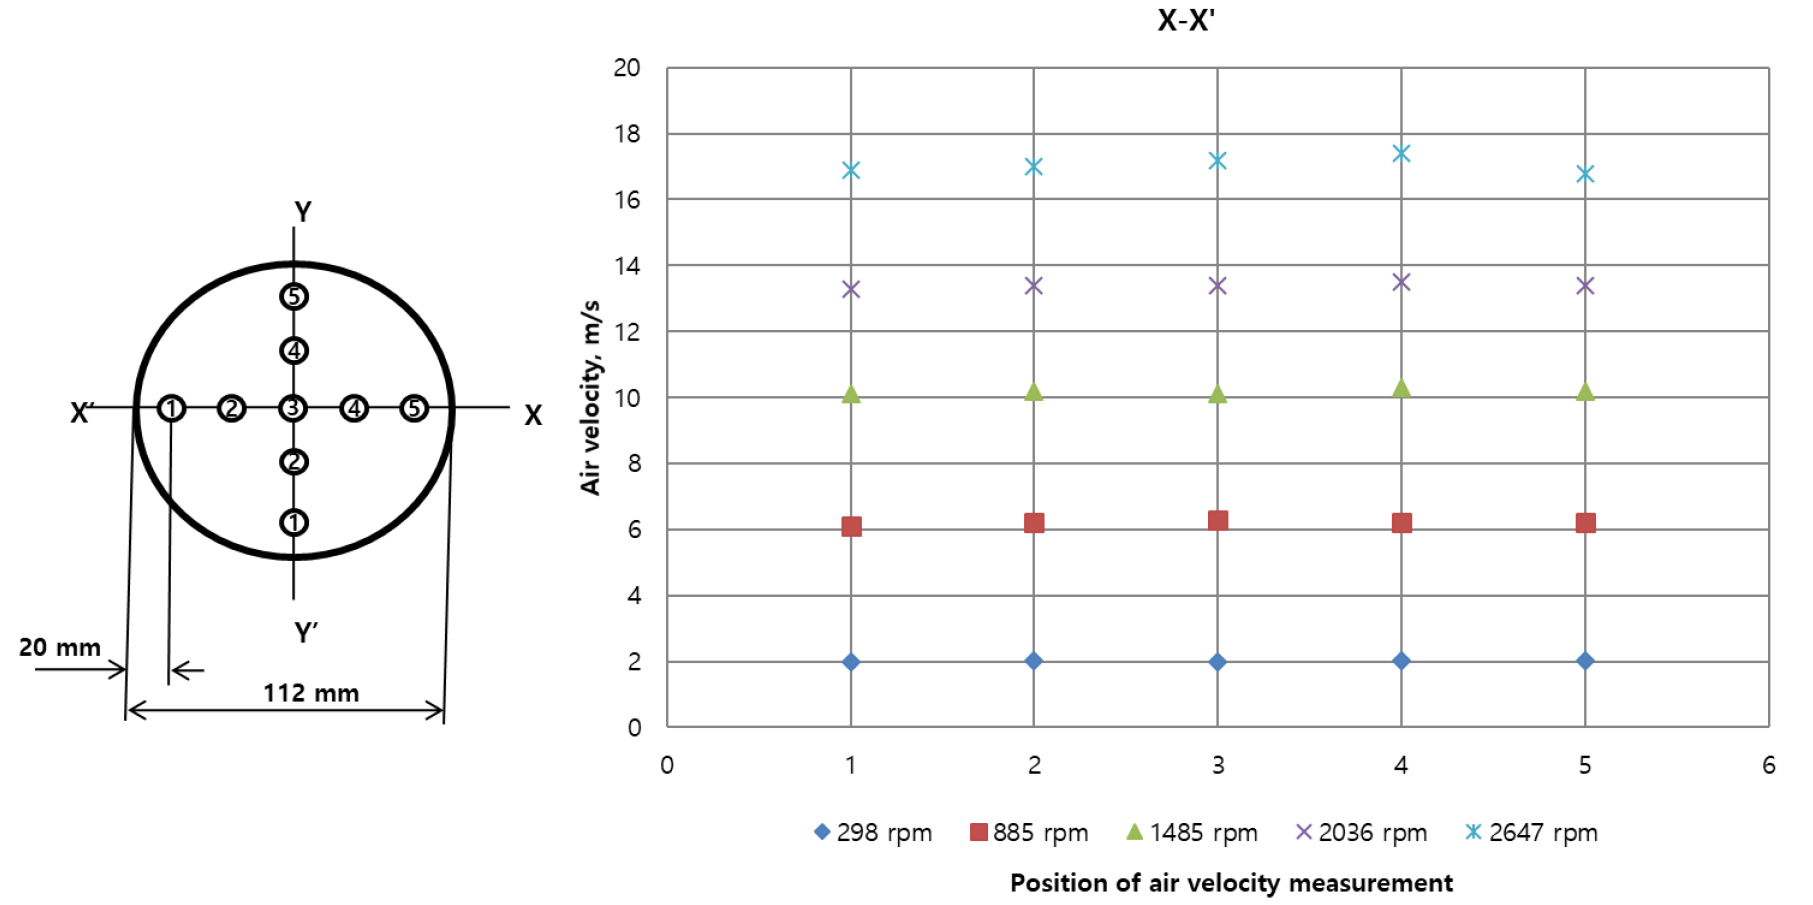
The vertical tube at the upper parts of vertical wind tunnel was connected with the distributor and plenum. Distributor with mesh 18 (0.98 mm) was commonly used for rapeseed, rice, and beans. After removing the vertical tube, grains were filled up in the plenum as shown in Fig. 1 and then the upper tube was re-connected. The static pressures were measured at 580 mm (Point A) and 2,960 mm (Point D) from the exit port of the vertical wind tunnel. The static pressures at those points were measured by L-shaped pitot tubes and the measured data were input to the data logger (midi LOGGER, GL200) by way of a pressure transducer (CP-200, KPMO). Also the air velocity was measured from point B by using a hot wire wind velocity sensor and was connected to the data logger through airflow transducer (CTV-200, KIMO). The air velocity at each point in the vertical tube as shown in Fig. 2 was measured depending on the fan rotation speed to check the uniformity of air velocity at the point B. The static pressure and air velocity was saved at data logger with 10 Hz of sampling rate.
Materials for experiments
The flow mobility depending on the grains types, the grains flow rates and the moisture contents of grains was measured using three grain types with four varieties i.e. rapeseed (Sunmang), rice (Chuchung, Ilpoom), and beans (Shingi). Each type of grain was identified with five physical characteristics to observe the flow mobility of grains depending on moisture contents as shown in Table 1. The thickness and width of rapeseed were not measured in this study. This is because rapeseed is round, so its thickness and width can be considered to similar to its length. Also, soybean is round and small, so width of soybean was not measured. The sample size for observing the fluidization of grains was set up about 400 g. Bed volume (grain flow rate) was also changed from 100 g to 500 g with an interval of 100 g to investigate the fluidization characteristics. The moisture contents of the grain samples were variable from 7.2% to 25.0% in rapeseed, from 15.8% to 24.7% in Chuchung rice, from 16.1% to 24.8% in Ilpoom rice, from 11.8% to 19.8% in soybeans.
Table 1.
Five physical characteristics of grains samples.
Experiment methods
The change of static pressure were measured from point A and D to determine the fluidization start-up velocity and the terminal velocity depending on the grain flow rate (bed volume) and moisture contents of grains such as the rapeseed, rice, and soybeans. Simultaneously the air velocity was also measured at from point B as a real time. Before starting the experiment, the air velocity at each point in the inside of point B was tested. The standard deviation and coefficient of variation about the air velocity at the inside of point B was 0.02~0.24 m/s and 0.52~1.41% depending on the fan rotation speed. It means that air velocity was uniform under the same rotational speed(rpm), thus it was judged that the air velocity range could be utilized in the experimental apparatus.
After feeding the grain on the distributor, the fluidization start-up velocity and terminal velocity were measured. When the air velocity was gradually increased, the grains became expanded and floated upwards and then few grains at upper surface of the grain bed started moving. The air velocity at this moment is the fluidization start-up velocity (Vf). On the other hands, the terminal velocity (Vt) was measured at the moment that the grains finally flew throughout the tube when the air velocity was gradually increased.
Results and Discussion
Characteristics of fluidization
Fig. 3 shows the change of static pressure drop depending on the air velocity for rapeseeds with time series of fluidization observation. The static pressure drop, that is the static pressure difference between A and C during air passes through grain layer as shown in Fig. 1, is occurred at the grain bed and distributor. As shown in Fig. 3 at the area of A, the rapeseeds were not moved from the beginning of test because the air could go through via the chink of rapeseeds in spite of increasing air velocity.
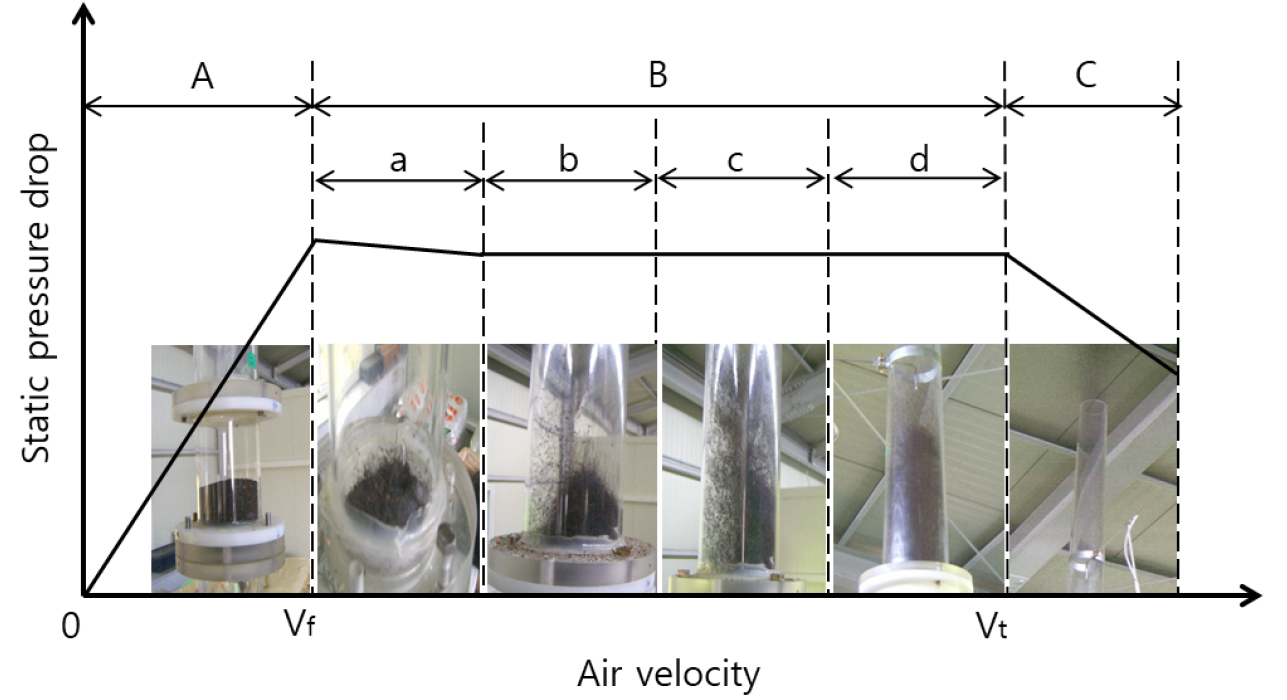
When the air velocity was further increased as shown in Fig. 3 at the region in zone (a), the static pressure drop decreased a little bit and the total charged rapeseeds became expanded. The rapeseeds were floated upwards and then a few grains at upper surface of the grain bed started moving a little. The air velocity at this moment is the fluidization start-up velocity (Vf) and it is the point that the fluidization is actively started. When air velocity was further increased, air was discharged from the wall of vertical tube or center of the grain bed. The route through where air was passing was visible and grain was discharged. With further increases of the air velocity, this phenomenon became more active such as a channeling phenomenon of grains passing the tunnel as shown in Fig. 3 at the region in zone (b). Afterwards, when the bed volume became decreased, the grain started a circulation movement just like the water boiling and moved upwards with increases in the air velocity. However, when the bed volume was high, the slugging phenomena that some part of grains in the bed volume repeated up and down like as the piston movement was observed as shown in Fig. 3 at the region in zone (c). With increases in the air velocity, this movement became violent, but the grain moved up high, atomized, dispersed, and flew throughout the tube as shown in Fig. 3 at the region in zone (d). At this moment, the static pressure was dropped. The air velocity at this pressure drop is called as a terminal velocity (Vt). When the air velocity was further increased, the rapeseeds were flown out from the vertical duct as shown in Fig. 3(C). Similar phenomena were observed from the rice and soybeans as well. Therefore, the optimum zone of the air velocity to improve the grain separation performance was judged as from the fluidization start-up zone (a) until the uniform fluidized zone (d).
Fluidization start-up velocity
The static pressure drop and minimum fluidization start-up velocity depending on the moisture contents and bed volume of grains were shown in Table 2. In the case of fluidization start-up velocity depending on the change of grains moisture contents, it was 0.65~0.74 m/s for rapeseeds, 1.30~1.63 m/s for rice, and 2.05~2.21 m/s for soybeans, respectively. The fluidization start-up velocity in this study was little higher in the maximum value than the study results by Umeda et al., (1971) who reported the fluidization start-up velocity 0.6~1.7 m/s. This might be due to difference in the shape, specific gravity, and variety of the grains. According to increase the moisture contents of grain, the fluidization start-up air velocity was also increased, excepting soybeans (p=0.258). It implies that moisture contents of the soybeans under the testing conditions in this study did not significantly effect on the fluidization start-up air velocity. That might be the difference in size of grains. However there was no relationship between the grain moisture content and the static pressure drop. Moreover the static pressure drop was not variable depending on the change of grain moisture content.
In the case of fluidization start-up velocity depending on the change of grain bed volume, it was 0.58~0.71 m/s for rapeseeds, 1.25~1.65 m/s for rice, and 1.54~2.13 m/s for soybeans, respectively. There were relationships between the grain bed volumes and the fluidization start-up air velocity, except Ilpoom (p=0.092) and soybean (p=0.051). In the case of Ilpoom, however, the fluidization start-up air velocity was relationship with the grain bed volume when the data of Ilpoom and Chuchung was combined as rice. Moreover the grain bed volumes had also significant relationships with the static pressure drops when the data of Ilpoom and Chuchung was combined as rice (p < 0.01). It means that the fluidization start-up velocity was linearly changed not only the change of moisture contents but also the change of grain bed volumes. However the static pressure drops was not variable depending on the change of moisture contents but changed depending on the grain bed volumes.
Table 2.
Minimum fluidization velocity depending on the changes of grain moisture content and grain bed volume.
| Category | Change of grain moisture content | Change of grain bed volume | |||||
| Crops | Variety | G.M.C. (%) | S.P.D. (Pa) | M.F.V. (m/s) | G.B.V. (g) | S.P.D. (Pa) | M.F.V. (m/s) |
| Rapeseed | Sunmang | 7.2 | 375 | 0.65 | 100 | 73 | 0.61 |
| 13.0 | 405 | 0.68 | 200 | 185 | 0.58 | ||
| 20.5 | 399 | 0.69 | 300 | 281 | 0.64 | ||
| 22.0 | 378 | 0.72 | 400 | 391 | 0.67 | ||
| 25.0 | 387 | 0.74 | 500 | 480 | 0.71 | ||
| Rough rice | Chuchung | 15.8 | 394 | 1.30 | 100 | 82 | 1.25 |
| 18.2 | 415 | 1.35 | 200 | 199 | 1.36 | ||
| 20.1 | 412 | 1.46 | 300 | 312 | 1.49 | ||
| 22.1 | 412 | 1.47 | 400 | 426 | 1.57 | ||
| 24.7 | 412 | 1.49 | 500 | 543 | 1.65 | ||
| Ilpoom | 16.1 | 401 | 1.37 | 100 | 88 | 1.25 | |
| 17.1 | 412 | 1.39 | 200 | 194 | 1.55 | ||
| 19.2 | 408 | 1.51 | 300 | 319 | 1.58 | ||
| 21.0 | 409 | 1.52 | 400 | 409 | 1.60 | ||
| 24.8 | 409 | 1.63 | 500 | 539 | 1.62 | ||
| Soybean | Shingi | 11.8 | 402 | 2.05 | 100 | 66 | 1.54 |
| 13.2 | 415 | 2.13 | 200 | 192 | 1.94 | ||
| 16.8 | 394 | 2.09 | 300 | 304 | 2.03 | ||
| 17.2 | 393 | 2.07 | 400 | 400 | 2.05 | ||
| 19.8 | 413 | 2.21 | 500 | 497 | 2.13 | ||
Table 3 shows an interaction formula for the minimum fluidization start-up velocity (M.F.V.) depending on the moisture contents and the bed volume of grains. There was significant linear regression between the grain moisture content and the minimum fluidization start-up velocity, except soybeans. In the case of grain bed volume, all grains had significant linear regression between the grain bed volume and minimum fluidization start-up velocity when the data of Ilpoom and Chuchung was combined as rice. This interaction formula would be useful in estimation of the minimum fluidization start-up velocity for the grain moisture contents and bed volume.
Table 3.
Interaction formula for the minimum fluidization velocity depending on the changes of grain moisture content and bed volume.
| Crops | Variety | Grain moisture content | Grain bed volume |
| Rapeseed | Sunmang | MFV = 0.005*GMC + 0.616 (R² = 0.895*) | MFV = 0.0003*GBV + 0.556 (R² =0.818*) |
| Rough rice | Chuchung | MFV = 0.023*GMC + 0.955 (R² = 0.868*) | MFV = 0.001*GBV + 1.161 (R² = 0.989**) |
| Ilpoom | MFV = 0.030*GMC + 0.893 (R² = 0.955**) | MFV = 0.0008*GBV + 1.283 (R² = 0.665) | |
| Total | MFV = 0.025*GMC + 0.947 (R² = 0.712**) | MFV = 0.0009*GBV + 1.222 (R² = 0.791***) | |
| Soybean | Shingi | MFV = 0.012*GMC + 1.917 (R² = 0.393) | MFV = 0.001*GBV + 1.551 (R² = 0.769) |
Terminal velocity
Table 4 shows the static pressure drop and the terminal velocity depending on the changes of grain moisture contents and bed volume. In the case of terminal velocity depending on the change of grains moisture contents, it was 5.97~6.60 m/s for rapeseeds, 7.10~7.78 m/s for rice, and 14.4~14.7 m/s for soybeans, respectively. According to increase the moisture contents of grain, the terminal velocity was also increased, excepting soybean. However there was no relationship between the terminal velocity and moisture content.
In the case of the terminal velocity depending on the change of grain bed volume, there was significant relationship not only between the grain bed volume and terminal velocity but also between the static pressured drop and terminal velocity. The terminal velocity was recorded as 5.96~7.33 m/s for rapeseeds, 7.26~8.68 m/s for rice, and 13.6~15 m/s for soybeans. The decreases of the terminal velocity might be due to increase of the static pressure drop following increases of the negative pressure areas as the grain bed volume was increased. The terminal velocity for the rice was in a range of 7.10~8.68 m/s depending on the moisture contents and bed volume in this study. It was higher than 6.2~8.2 m/s as the result of research by Nonami et al. (2002). This difference in the minimum and maximum terminal velocity might be due to the difference in shape, specific gravity, and variety of the grains.
Table 4.
Terminal velocity as change of the grain moisture content and bed volume.
| Category | Change of grain moisture content | Change of grain bed volume | |||||
| Crops | Variety | G.M.C. (%) | S.P.D. (Pa) | T.V. (m/s) | G.B.V. (g) | S.P.D. (Pa) | T.V. (m/s) |
| Rapeseed | Sunmang | 7.2 | 375 | 5.97 | 100 | 73 | 7.33 |
| 13.0 | 405 | 6.13 | 200 | 185 | 6.86 | ||
| 20.5 | 399 | 6.46 | 300 | 281 | 6.14 | ||
| 22.0 | 378 | 6.52 | 400 | 391 | 6.00 | ||
| 25.0 | 387 | 6.60 | 500 | 480 | 5.96 | ||
| Rough rice | Chuchung | 15.8 | 394 | 7.10 | 100 | 82 | 8.61 |
| 18.2 | 415 | 7.46 | 200 | 199 | 8.3 | ||
| 20.1 | 412 | 7.44 | 300 | 312 | 7.99 | ||
| 22.1 | 412 | 7.52 | 400 | 426 | 7.57 | ||
| 24.7 | 412 | 7.62 | 500 | 543 | 7.26 | ||
| Ilpoom | 16.1 | 401 | 7.23 | 100 | 88 | 8.68 | |
| 17.1 | 412 | 7.48 | 200 | 194 | 8.02 | ||
| 19.2 | 408 | 7.45 | 300 | 319 | 7.87 | ||
| 21.0 | 409 | 7.53 | 400 | 409 | 7.73 | ||
| 24.8 | 409 | 7.78 | 500 | 539 | 7.43 | ||
| Soybean | Shingi | 11.8 | 402 | 14.4 | 100 | 66 | 15.6 |
| 13.2 | 415 | 14.5 | 200 | 192 | 15.0 | ||
| 16.8 | 394 | 14.5 | 300 | 304 | 14.4 | ||
| 17.2 | 393 | 14.7 | 400 | 400 | 13.6 | ||
| 19.8 | 413 | 14.5 | 500 | 497 | 13.8 | ||
The interaction formula for terminal velocity depending on the moisture contents and grain bed volume for different grain were shown in Table 4. Interaction formula indicates that the terminal velocity was significantly correlated with the moisture contents and grain bed volume except soybeans. Moreover, there was also significant linear regression with the grain bed volume and terminal velocity. It was judged that this interaction formula could be utilized well to estimate terminal velocity according to the unknown grain moisture contents and grain bed volume.
Table 5.
Interaction formula of the terminal velocity as the grain moisture content and bed volume.
| Crops | Variety | Grain moisture content | Grain bed volume |
| Rapeseed | Sunmang |
TV = 0.037*GMC + 5.684 (R² = 0.992**) | TV = -0.004*GBV + 7.538 (R² = 0.875*) |
| Rough rice | Chuchung |
TV = 0.051*GMC + 6.400 (R² = 0.803) | TV = -0.003*GBV + 8.975 (R² = 0.997**) |
| Ilpoom |
TV = 0.053*GMC + 6.458 (R² = 0.856*) | TV = -0.003*GBV + 8.783 (R² = 0.902*) | |
| Total |
TV = 0.051*GMC + 6.453 (R² = 0.767***) | TV = -0.003*GBV + 8.879 (R² = 0.947***) | |
| Soybean | Shingi |
TV = 0.016*GMC + 14.26 (R² = 0.234) | TV = -0.005GBV + 15.98 (R² = 0.903*) |
Fig. 4 shows a graph displaying a correlation between the air velocity and the static pressure drop according to the moisture contents in the Chuchung rice. The fluidization start-up velocity and terminal velocity might be not influenced by the change of grain moisture content even if there was significant relationship between the fluidization start-up velocity and grain moisture content and also between the terminal velocity and grain moisture content as shown in Table 3 and Table 5. When the result of Table 2 and Table 4 was compared to each other, the fluidization start-up velocity and terminal velocity might be mainly influenced not by the grain moisture content but by the type of grains.
Fig. 5 shows a correlation between the air velocity and the static pressure drop by the bed volume changes of Chuchung rice. The fluidization start-up velocity and terminal velocity might be influenced by the change of grain bed volumes as shown Table 3 and Table 5. The change of terminal velocity depending on the grain bed volume was more variable than it of fluidization start-up velocity. Moreover the fluidization start-up velocity depending on the grain moisture and grain bed volume was almost similar to each other. It means that the fluidization start-up velocity might be less influenced by the change of the grain moisture content and grain bed volume comparing with the terminal velocity that was influenced by not only the change of the grain moisture content but also the grain bed volume as shown in Table 2 and Table 4.
The range of fluidization start-up air velocity by moisture contents changes in the grain was broader than that of the bed volume changes. These results indicate that bed volume variation affects more on the fluidization start-up velocity than that of moisture variation of the grains.
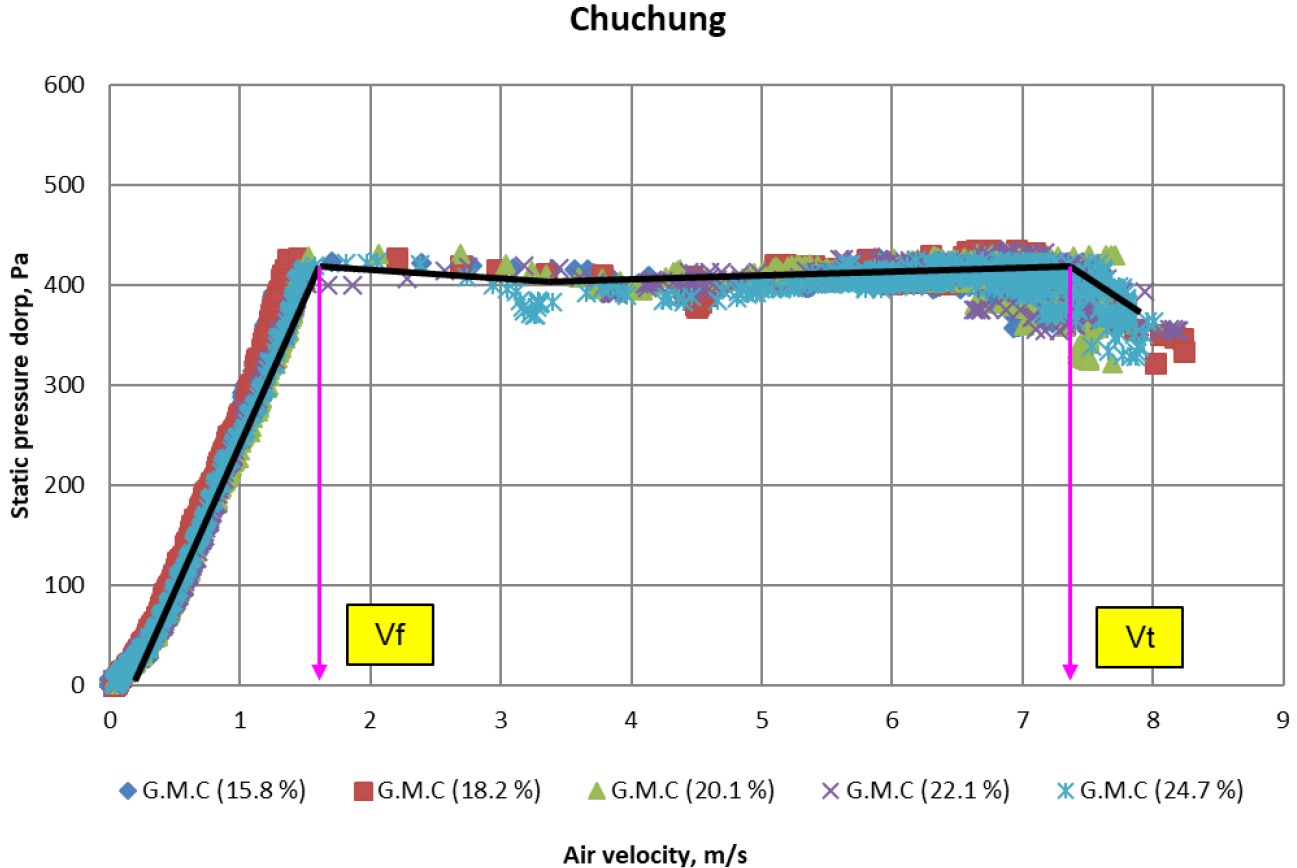
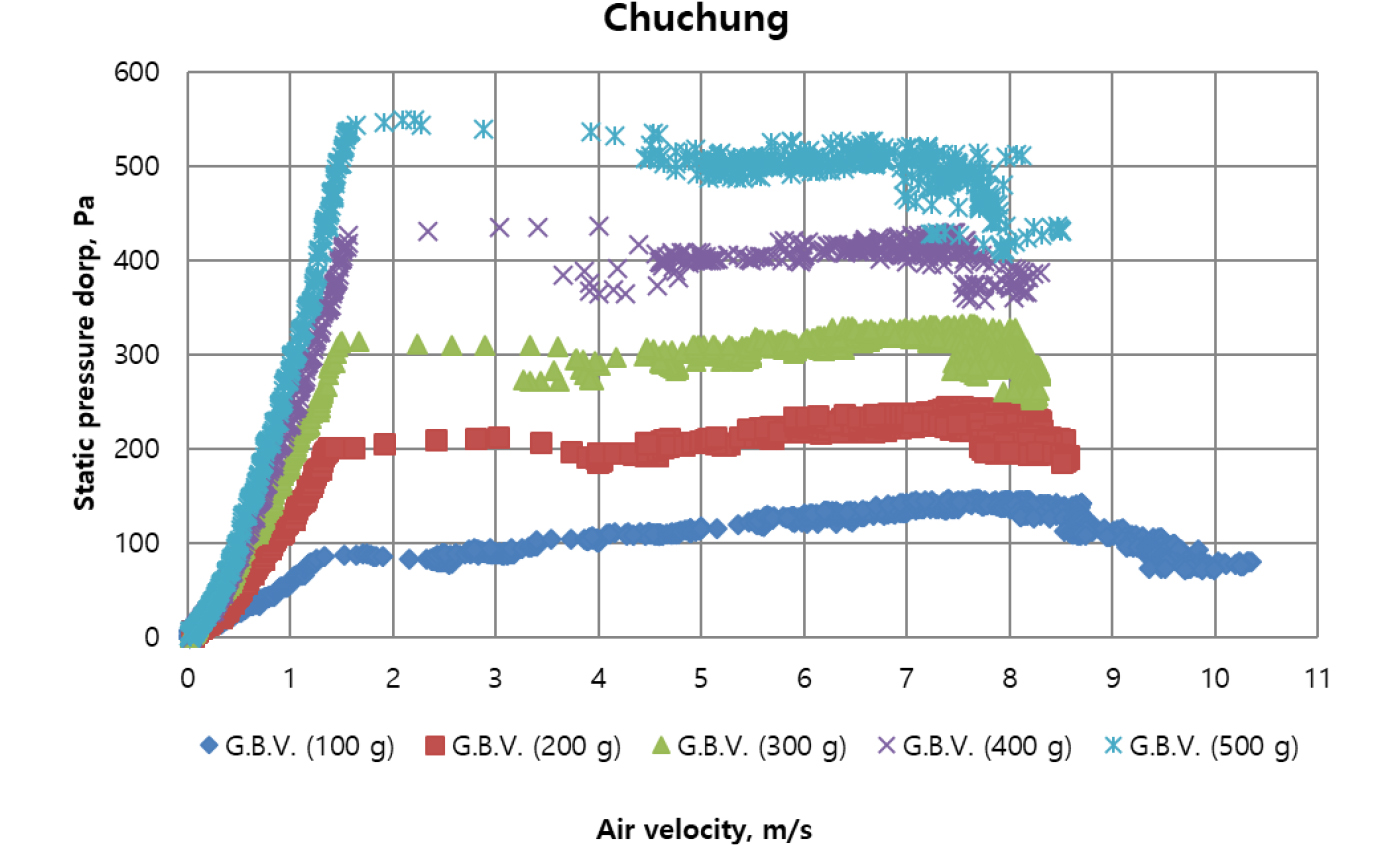
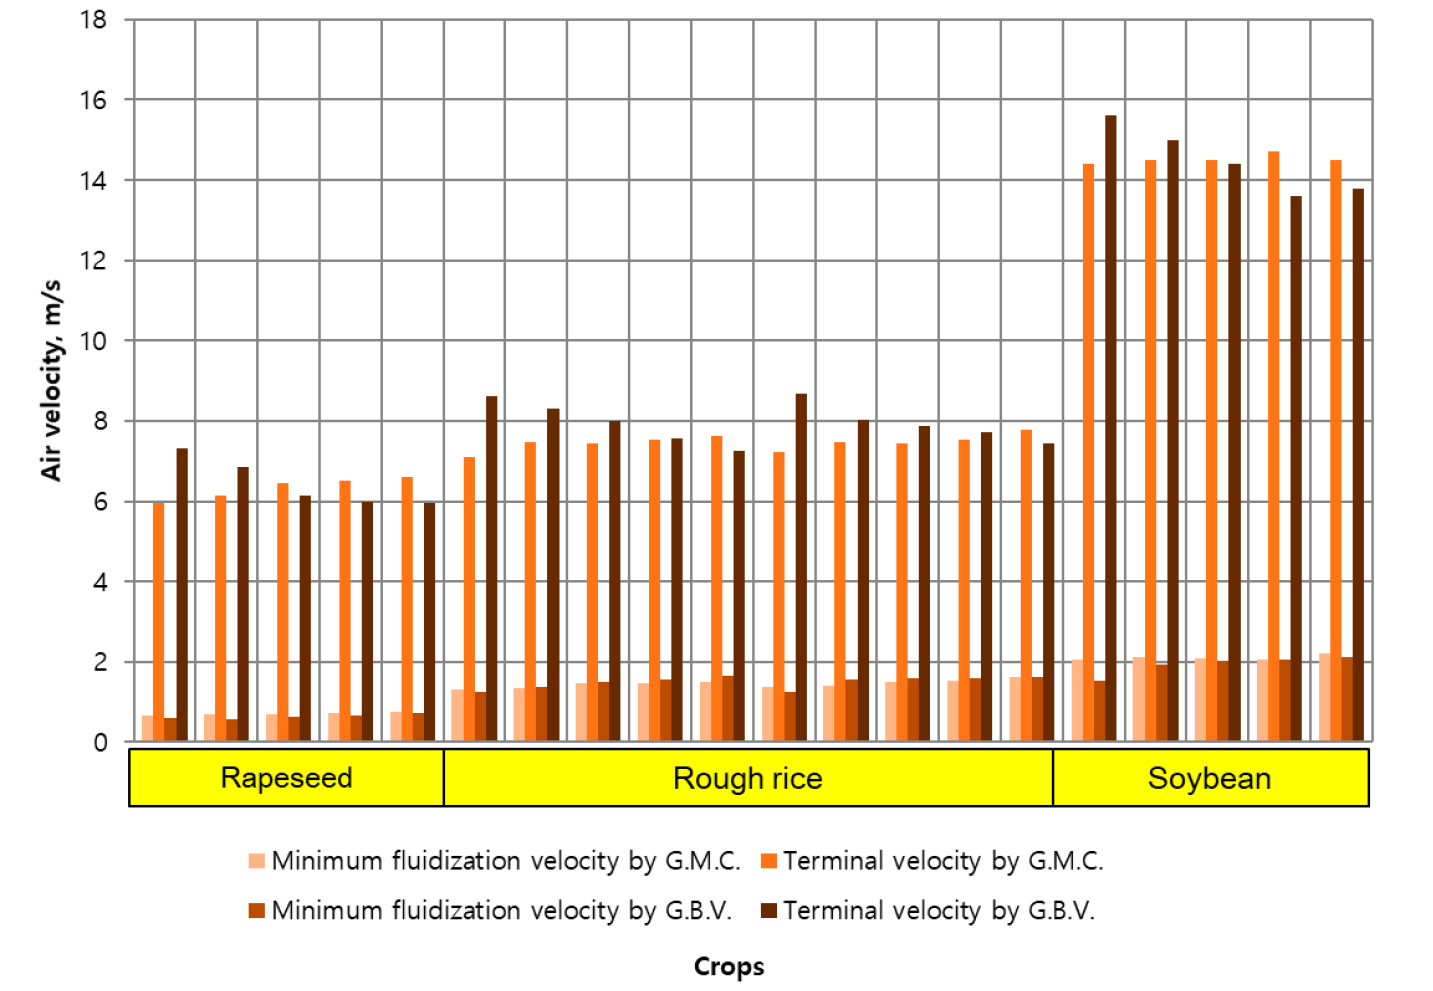
Fig. 6 shows a graph combining minimum fluidization start-up velocity and terminal velocity by changes of the moisture contents and the bed volume. Minimum fluidization start-up velocity and terminal velocity range could be figured out at a glance from the graph, thus it would be a reference to be used as design parameters to improve the separation performance of combines.
Summary and Conclusion
In this study, fluidization characteristics, fluidization start-up velocity, and terminal velocity for different grains and grain moisture contents were analyzed to investigate factors affecting on the separation capacity of combines with the objective of performance improvement. The obtained results are as follows:
(1)The fluidization start-up velocity was increased according to moisture contents and bed volume of the grains except soybeans. The fluidization start-up velocity was found as 0.65~0.74 m/s for the rapeseeds, 1.30~1.63 m/s for the rice, and 2.05~2.21 m/s for the soybeans. The fluidization start-up velocity according to the bed volume change was found as 0.61~0.71 m/s for the rapeseeds, 1.25~1.65 m/s for the rice, and 1.54~2.13 m/s for the soybeans.
(2)The terminal velocity showed similar results as fluidized start-up velocity with range of 5.97~6.60 m/s for the rapeseeds, 7.10~7.78 m/s for the rice, and 14.4~14.7m/s for the soybeans, respectively. The terminal velocity by changes of the grain bed volume was 5.96~7.33 m/s for the rapeseeds, 7.26~8.68 m/s for the rice, and 13.6~15.6 m/s for the soybeans.
(3)The interaction formula between fluidization start-up velocity and terminal velocity according to moisture contents and bed volume of the grains was highly correlated except soybeans.
