Research Article

Precision Agriculture Science and Technology. 30 September 2024. 208-217
https://doi.org/10.22765/pastj.20240015

ABSTRACT


MAIN

  • Introduction

  • Materials and Methods

  •   실험대상 및 장소

  •   다중분광 영상 데이터 취득

  •   다중분광 이미지 처리

  •   이상치제거

  •   다중공선성 확인

  •   선형회귀 분석

  • Results and Discussions

  • Conclusion

Introduction

Intergovernmental Panel of Climate Change(IPCC)의 보고서에서는 최근 기후변화로 현재의 농업, 어업, 축산업을 영위하는 지역이 2050년까지 10%, 2100년까지 30% 이상 감소할 것으로 전망하고 있으며(Climate Change 2022: Impacts, Adaptation and Vulnerability), 2050년까지 전체 식량공급이 약 4% 줄어들 것이라고 한다(Zhu et al., 2022). 유엔식량농업기구(Food and Agriculture Organization of the United Nations(FAO), 2023)에서 발표한 세계식품가격지수(FAO Food Price Index, FFPI)에 따르면 2021년 세계적인 이상기후로 농작물의 생산량이 급격히 감소했고, 2023년까지 농산물 가격이 급등한 것으로 나타나 식량자급률이 낮은 한국에는 더더욱 치명적일 것으로 사료된다. 농림축산부에 따르면 한국의 식량자급률은 2021년 기준 44.4%로 지속적으로 낮아지고 있으며, OECD 국가 중 최하위를 기록하고 있어 한국의 식량안보가 위협을 받는 상황이다.

한국 5대 밭작물 중 하나이며, 김치의 주 재료인 고추는 이러한 중요성에도 불구하고, 자급률이 급격히 감소하고 있다. 2000년에는 고추 자급률이 89%에 달했으나, 2016년에는 52%로 하락했다(KREI, 2017). 더 나아가 급격한 기후변화로 인한 생산성 감소, 재배농가의 노령화, 재배면적 감소에 따른 생산량 감소까지 더해져 국내 고추산업이 붕괴할 위기에 처해있다. 따라서 고추에 대한 연구는 국내 고추 농업의 지속 가능성을 확보하고, 고추산업의 경쟁력을 높이며, 나아가 국민의 식량 안보를 지키기 위해 필수적이다.

현재 많은 정부 기관과 농업기업들은 무인기를 이용한 정밀농업에 많은 투자와 연구를 하고 있다(Delavarpour et al., 2021; Su et al., 2023). 최근 다양한 분야에서 무인기를 활용하고 있으며, 농업에서는 무인기를 이용한 작황 모니터링을 통해 기존 위성 영상을 이용한 방법보다 현장에 대한 정보를 더 자주 그리고 정밀도 높게 수집하는 것이 가능하다(Stehr, 2015). 또한 무인기는 날씨, 지형조건에 제한되지 않고, 이미지 획득 타이밍이 비교적 자유로우며, RGB, 다중분광, 초분광, 열화상, Light Detection And Ranging(LiDAR)과 같은 다양한 센서를 사용할 수 있다(García-Martínez et al., 2020). 무인기를 활용한 농업 연구는 감자(Li et al., 2020), 쌀(Ryu et al., 2009; Kang et al., 2021), 옥수수(Kumar et al., 2023; Hu et al., 2024)등 일부 작물을 대상으로 활발히 진행되고 있으나, 다른 노지 작물에 관한 연구는 상대적으로 부족한 상황이다.

본 연구는 무인기를 이용한 다중분광 영상 내 고추 캐노피 영역의 5 bands 반사값을 이용해 산출한 식생지수로 고추의 초장과 상관성이 높은 인자를 찾고, 초장 추정모델을 개발하여 고추의 품질향상 및 생산량 증대를 기대할 수 있는 기초 자료를 확보하는 것을 목표로 한다.

Materials and Methods

실험대상 및 장소

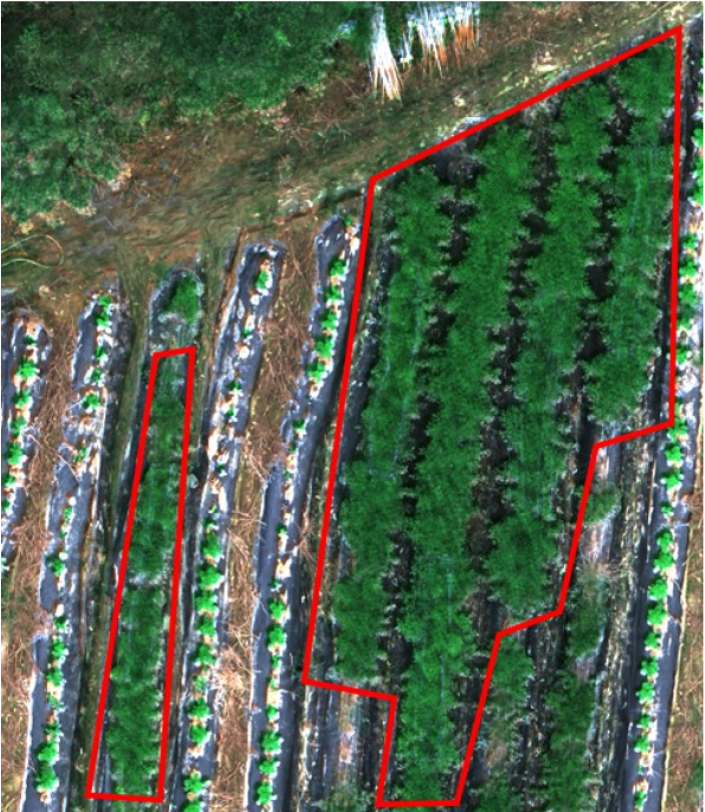
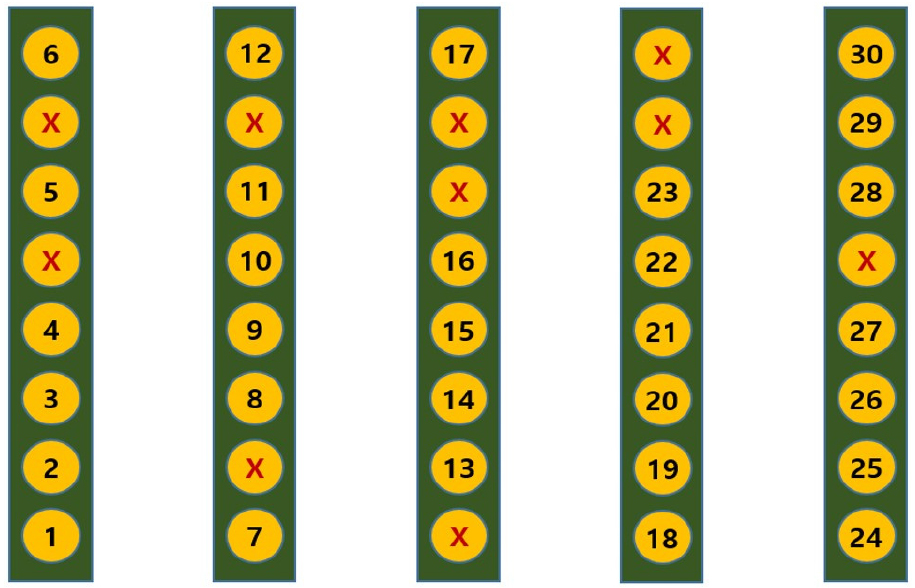
본 실험은 전라북도 김제시 용지면 예촌리 고추(Colormura, Capsicum annuum L.) 농가 포장(35°51’5.04”N 126°57’57.60”E, Fig. 1)에서 진행하였다. 2023년 5월 2일에 정식한 후 임의로 30개의 모종을 실험 대상으로 선정하여 샘플 위치를 Fig. 2와 같이 다시 설정하여 9월 25일에 수확량과 상관성이 높은 초장(Cankaya et al., 2010)에 대해 생육조사를 진행하였다.

https://cdn.apub.kr/journalsite/sites/kspa/2024-006-03/N0570060304/images/kspa_2024_063_208_F1.jpg
Fig. 1.

Jeollabuk-do Gimje-si Yongji-myeon Yechon-ri farm field.

https://cdn.apub.kr/journalsite/sites/kspa/2024-006-03/N0570060304/images/kspa_2024_063_208_F2.jpg
Fig. 2.

Layout of experimental configuration at farm field on 25th, September.

다중분광 영상 데이터 취득

Matrice 300 RTK(DJI Technology Inc, China)에 다중분광 센서(Table 1) Altum-PT(MicaSense Inc, USA)를 탑재하여 센서 보정 후 고도 25 m, 비행 속도 4 m/s, 종횡비 75%로 정오에 촬영하였다. 영상 접합 기준점 설정을 위해 HI-Target V60(KOSECO Inc, Korea)을 사용하여 Ground Control Point(GCP)를 측정하였다.

Table 1.

Multispectral Sensor.

Category Multispectral Sensor
Model Altum-PT
Manufacture MicaSense
Center wavelengths and bandwidth 475 nm ± 32 nm (Blue)
560 nm ± 27 nm (Green)
668 nm ± 14 nm (Red)
717 nm ± 12 nm (RedEdge)
842 nm ± 57 nm (NIR)
10.5 μm ± 6 μm (Thermal)
634.5 nm ± 463 nm (Panchromatic)
GSD @25 m 1.08 cm/pixel
Panchromatic GSD @25 m 0.52 cm/pixel

다중분광 이미지 처리

촬영된 개별 영상 데이터를 Pix4D mapper(Pix4D S.A., Switerland)를 이용하여 정합한 후 QGIS(Quantum GIS, USA)로 Pansharpening을 진행하였다. ENVI 5.6(Exelis Visual Information Solution Inc., USA)의 Band math기능을 이용하여 잎을 구별할 때 유용한 GNDVI-NDVI로 배경과 작물을 density slice로 분리하는 임계값을 설정하였다(Onoyama et al., 2018). 고춧잎의 겹침으로 인한 문제를 최소화하기 위해 중심을 기준으로 원 안에 존재하는 고추 잎 부분만을 관심영역(Region of Interest, ROI)으로 지정하여 각 고추의 반사값을 추출하였다.

(1)
GNDVINDVI=NIR-GreenNIR+Green-NIR-RedNIR+Red

https://cdn.apub.kr/journalsite/sites/kspa/2024-006-03/N0570060304/images/kspa_2024_063_208_F3.jpg
Fig. 3.

(a) raw RGB image; (b), (c) extraction of individual canopies; (d) specify ROI.

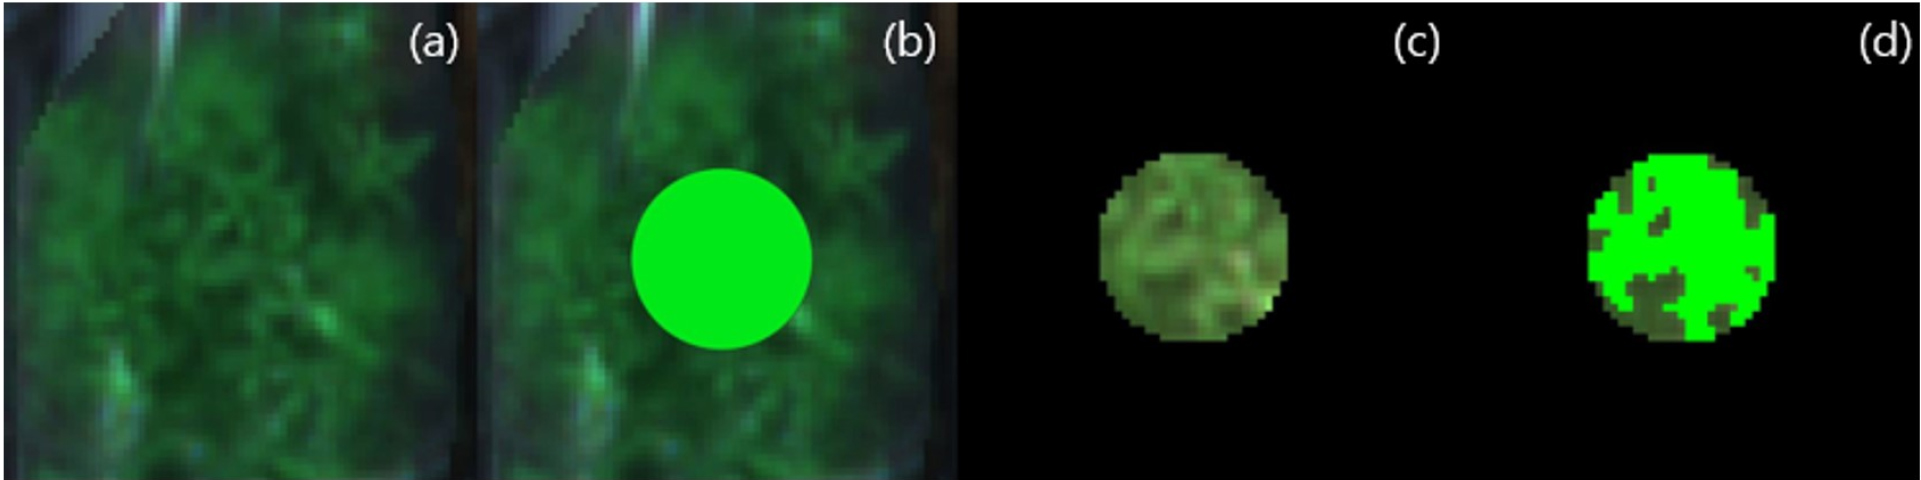
Table 2에 추출한 반사값을 이용하여 계산한 Vegetation Indices(VIs)를 표에 나타내었다. 5 bands의 반사값은 환경에 민감하여 식생지수로 변환 시 변동성이 줄어들기 때문에 고추의 반사값으로부터 정규화 식생지수 NDVI, GNDVI, NDRE, PRI 단순비 식생지수 RVI, GRVI, 단순식 식생지수 DVI, 변형된 식생지수 SAVI, OSAVI, TCARI를 산출하여 사용하였다.

Table 2.

Vegetation Indices (VIs).

Name Calculation Reference
NDVINIR-RedNIR+Red (Xue et al., 2017)
GNDVINIR-GreenNIR+Green (Marcial-Pablo et al., 2018)
GRVINIRGreen (Sripada et al., 2006)
RVINIRRed (Yaghobi et al., 2019)
DVINIR-Red (Naji, 2018)
NDRENIR-RedEdgeNIR+RedEdge (Barnes et al., 2000)
SAVI1.5×(NIR-Red)NIR-Red+0.5 (Huete, 1988)
PRIBlue-GreenBlue+Green (Yoon et al., 2021)
(Ryu et al., 2021)
OSAVINIR-RedNIR+Red+0.16 (Xue et al., 2017)
TCARI3[RedEdge-0.2(RedEdge-Green)(RedEdgeRed) (Haboudane et al., 2002)

이상치제거

생육정보와 분광값의 이상치는 사분위수(InterQuartile Range, IQR)에 1.5를 곱하여 더하고 뺀 값을 최댓값, 최소값으로 정하여 범위밖의 데이터를 제거하는 IQR방식을 사용하였다(Yang et al., 2019).

다중공선성 확인

다중선형회귀 시 독립변수 간의 강한 상관관계로 왜곡된 결과를 도출할 수 있는(Shrestha, 2020) 다중공선성을 확인하기 위해 Variance Inflation Factors(VIF) 검사를 진행하였다. VIF가 10이상이 확인된 독립변수 중 상관성이 큰 변수를 후진 소거법으로 하나씩 제거하였다.

선형회귀 분석

각 생육정보에 대하여 5 bands와 VIs를 이용하여 단순선형회귀와 다중선형회귀분석을 진행하였다. 단순선형회귀는 연속형 종속변수에 영향을 미치는 인자를 찾을 때 이용하는 분석으로(Seber et al., 2012) 한 개의 독립변수와 한 개의 종속변수와의 관계를 설명하는 데 사용된다(Park and Lee, 2014). 다중선형회귀는 둘 이상의 독립변수가 종속변수에 영향을 미칠 때 사용하는 방법이다(Yohanani et al., 2022).

선형회귀 시 Train:Validation 데이터 비율은 교차검증을 위하여 8:2, 7:2, 6:4 3가지로 설정하였다. 모델 평가 방법으로는 Eq. (2), (3), (4)과 같이 결정계수(R2)와 Root Mean Square Error(RMSE), Mean Absolute Error(MAPE)를 사용하였다(Yang et al., 2022; Yohanani et al., 2022). 모델 분석 시 R2T > 0.6, MAPE < 10%이며, 모델의 안정성을 고려하여 RMSET(RMSE of Train)와 RMSEV(RMSE of Validation)차이가 작은 모델을 좋은 모델로 판단하였다(Lewis, 1982).

(2)
R2=1-SSESST=SSRSST
(3)
RMSE=MSE=(y^-y)2n
(4)
MAPE=100ni=1n|Yi-Y^iYi

선형회귀를 이용하여 도출된 회귀식에서 각 독립변수가 종속변수에 미치는 영향을 분석하기위해 표준화 회귀계수를 계산하여 절대값을 비교하였다(Bring, 1994).

Results and Discussions

2023년 9월 25일의 초장, 분광값 및 식생지수의 이상치를 제거한 평균 및 표준편차를 Table 3에 나타내었다. 생육정보의 이상치는 초장에서 5개, 분광 데이터에서 Green과 RedEdge에서 각각 1개씩 존재하였다. green과 red edge에서 이상치가 존재했기 때문에 GNDVI, GRVI, NDRE, PRI에서도 이상치가 존재했다. 총 30개의 데이터 중 이상치 7개를 제외한 23개의 데이터로 실험이 진행되었다.

Table 3.

September 25. The average and standard deviation of pepper growth information, 5 bands, VIs.

23.09.25, n=30 Outlier Mean ± Standard deviation
Plant height (cm) 5 119.3 ± 4.793
NDVI 0 0.899± 0.012
GNDVI 1 0.747 ± 0.016
GRVI 1 6.949 ± 0.491
RVI 0 19.12 ± 2.303
DVI 0 0.336 ± 0.027
NDRE 1 0.428 ± 0.019
SAVI 0 0.576 ± 0.028
PRI 1 -0.487 ± 0.036
OSAVI 0 0.729 ± 0.022
TCARI 1 -0.046 ± 0.045

VIs를 이용한 단순선형회귀를 진행하였다(Table 4). 유의미한 모델은 존재하였으나, 제시한 조건(R2T > 0.6)을 만족하는 모델을 확인할 수 없었다.

Table 4.

Simple linear Regression results using VIs to Plant height.

8:2
VIs NDVI GNDVI GRVI RVI DVI
R2T 0.232 0.043 0.041 0.249* 0.052
RMSET (cm) 2.874 3.210 3.214 2.843 3.195
MAPET (%) 1.652 1.833 1.824 1.615 1.862
R2V 0.204 -0.034 0.044 0.246 -0.164
RMSEV (cm) 4.083 3.782 3.801 4.153 3.401
MAPEV (%) 2.996 2.761 2.773 3.033 2.439
VIs NDRE SAVI PRI OSAVI TCARI
R2T 0.000 0.072 0.446*** 0.110 0.398**
RMSET (cm) 3.281 3.161 2.669 3.095 2.547
MAPET (%) 1.922 1.870 1.191 1.861 1.553
R2V -0.059 0.151 0.302 0.115 -0.381
RMSEV (cm) 3.829 3.427 4.430 3.499 4.372
MAPEV (%) 2.877 2.456 3.943 2.534 3.275
7:3
VIs NDVI GNDVI GRVI RVI DVI
R2T 0.303* 0.058 0.051 0.310* 0.059
RMSET (cm) 2.916 3.389 3.402 2.900 3.388
MAPET (%) 1.715 1.920 1.940 1.655 2.046
R2V 0.199 -0.102 0.083 0.111 -0.177
RMSEV (cm) 3.947 3.328 3.300 3.932 2.876
MAPEV (%) 2.857 2.233 2.185 2.836 1.936
VIs NDRE SAVI PRI OSAVI TCARI
R2T 0.000 0.085 0.456*** 0.137 0.450**
RMSET (cm) 3.491 3.340 2.112 3.479 2.589
MAPET (%) 2.152 2.038 1.208 1.981 1.558
R2V -0.053 0.151 0.492 0.040 -0.603
RMSEV (cm) 3.253 2.937 4.471 3.106 4.014
MAPEV (%) 2.157 2.042 3.312 2.245 2.955
6:4
VIs NDVI GNDVI GRVI RVI DVI
R2T 0.297 0.055 0.049 0.306* 0.052
RMSET (cm) 3.128 3.626 3.638 3.108 3.632
MAPET (%) 1.933 2.085 2.103 1.868 2.281
R2V 0.201 -0.134 0.121 0.245 -0.167
RMSEV (cm) 3.485 2.988 2.972 3.481 2.562
MAPEV (%) 2.284 1.890 1.867 2.288 1.596
VIs NDRE SAVI PRI OSAVI TCARI
R2T 0.001 0.078 0.371** 0.130 0.448*
RMSET (cm) 3.729 3.582 2.181 3.479 2.771
MAPET (%) 2.346 2.275 1.341 2.224 1.759
R2V -0.100 0.137 0.477 0.041 -0.603
RMSEV (cm) 2.943 2.607 4.003 2.749 3.553
MAPEV (%) 1.880 1.680 2.656 1.840 2.378

*p<0.05, **p<0.01,***p<0.001.

VIs에서 상관성이 큰 변수를 후진 소거법으로 제거하여 다중공선성을 확인한 결과 Table 5과 같이 PRI, GRVI, SAVI가 VIF 10이하로 선택되었다.

Table 5.

VI’s VIF factor less than 10.

VIs VIF
PRI 1.857
GRVI 8.354
SAVI 8.801

PRI, GRVI, SAVI를 이용한 다중선형회귀 결과를 Table 6에 나타내었다. 모든 비율에서 제시한 조건을 만족하였지만, R2V는 R2T에 비하여 낮은값을 나타내었는데, 이는 Validation 데이터의 표본이 적기 때문으로 사료된다. R2T는 7:3 모델이 가장 높았으나 6:4비율의 모델의 R2V가 더 높고, RMSEC와 RMSEV의 차이가 적어 초장 추정성능이 더 좋다고 판단하였다.

Table 6.

Multiple Linear Regression using PRI, GRVI, SAVI to Plant height.

Plant height 6:4 7:3 8:2
R2T 0.638** 0.641*** 0.601***
RMSET (cm) 2.245 2.092 2.086
MAPET (%) 1.183 1.163 1.313
R2V 0.338 0.329 0.205
RMSEV (cm) 3.980 4.513 5.093
MAPEV (%) 4.096 3.339 3.987

*p<0.05, **p<0.01,***p<0.001.

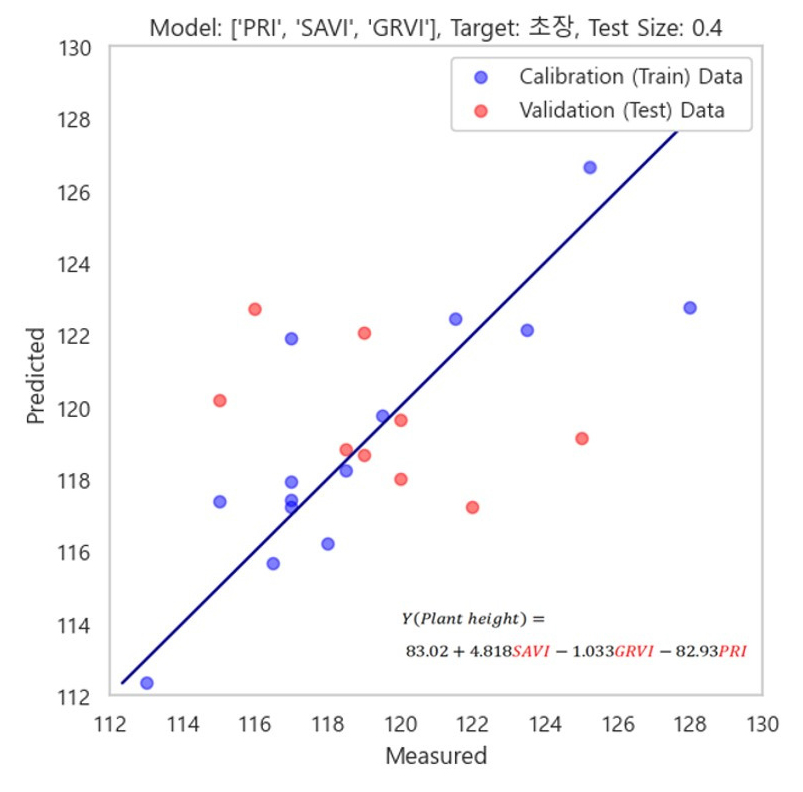
Fig. 4에 PRI, GRVI, 및 SAVI를 이용한 6:4 비율의 고추 초장 추정모델의 산점도와 회귀식을 나타내었다. R2T = 0.638, RMSET = 2.245 cm, MAPET = 1.183%, R2V = 0.338, RMSEV = 3.980 cm, MAPEV = 4.096%으로 가장 우수한 예측성능을 나타내었다. 추후 데이터의 축적을 통해 초장 추정모델의 성능을 향상시킬 수 있을 것으로 사료된다.

https://cdn.apub.kr/journalsite/sites/kspa/2024-006-03/N0570060304/images/kspa_2024_063_208_F4.jpg
Fig. 4.

The best model of Multiple linear regression.

고추 초장 추정 시 단순선형회귀보다는 다중선형회귀가 유리한 것으로 사료된다. 선택한 모델의 독립변수들 간의 상대적인 영향력을 알아보기 위해 표준화 회귀계수를 Table 7에 나타내었다.

Table 7.

Standardized Regression Coefficients.

VIs Standardized Regression Coefficients
PRI 0.471
SAVI 0.292
GRVI 0.190

표준화 회귀계수 결과 PRI, SAVI, GRVI 순으로 초장 예측에 대한 가중치가 높았다. Table 4의 단순선형회귀 모델에서, TCARI를 이용한 6:4 모델을 제외한 모든 경우에서 PRI를 사용한 모델이 상대적으로 좋은 성능을 나타내었다. PRI는 식물의 생리적 특성 및 스트레스를 잘 나타내는 식생지수(Yoon et al., 2021)이며, 단순선형회귀에서 높은 성능을 가질 뿐만 아니라 선택된 모델에서 높은 가중치를 보이기 때문에 초장과 밀접한 관계를 나타내는 것으로 사료된다. 상대적으로 높은 상관관계를 나타낸 RVI와 TCARI는 VIF 검사에서 제거되었다. 이는 VIF가 높은 순으로 변수를 제거할 때, 선택된 식생지수 PRI, GRVI, SAVI와 높은 상관성이 있어 제거된 것으로 사료된다. 하지만 R2V의 경우 R2T보다 상대적으로 낮은 값을 나타내었는데, 이는 추후 다년차 데이터의 축적을 통해 초장 추정모델의 성능을 향상시킬 수 있을 것으로 기대된다.

Conclusion

본 연구는 무인기를 이용한 다중분광영상의 식생지수를 이용하여 고추의 초장을 추정하는 모델을 개발하는 것을 목적으로 수행되었다. 수확기 고추의 다중분광 데이터를 이용여 계산한 VIs의 단순선형회귀 모델에서는 유의미한 결과는 있었으나, 조건을 만족하는 모델은 없었다. VIF로 선택된 PRI, GRVI, SAVI을 이용한 다중선형회귀 모델은 학습 데이터의 비율에 상관없이 조건을 만족하였고, Validation 성능이 더 뛰어난 6:4 비율의 모델(R2T = 0.638, RMSET = 2.245 cm, MAPET = 1.183%, R2V = 0.338, RMSEV = 3.980 cm, MAPEV = 4.096%)을 초장 추정모델로 선정하였다. 선정된 모델의 표준화된 회귀계수 확인 결과 PRI, SAVI, GRVI순으로 초장에 큰 영향을 주는 것으로 나타났다. 고추의 초장 추정 시 단순선형회귀보다는 다중선형회귀가 정확하였다. 추후 다년차 생육정보, 기상 데이터 축적(Kang et al., 2020) 및 머신러닝(Yang et. al., 2024), 딥러닝(Kang et al., 2021), 앙상블(Chen et. al., 2022)을 통해 모델의 성능을 향상시킬 수 있을 것으로 기대된다.

Acknowledgements

이 연구는 2024년도 산업통상자원부 및 산업기술평가관리원(KEIT)연구비 지원에 의한 연구임(‘20018635’).

References

1

Barnes, E.M., Clarke, T.R., Richards, S.E., Colaizzi, P.D., Haberland, J., Kostrzewski, M., Waller, P., Choi, C., Riley. E., Thompson, T., Lascano, R.J., Li, H., Moran, M.S. 2000. Coincident detection of crop water stress, nitrogen status and canopy density using ground based multispectral data. In Proceedings of the fifth international conference on precision agriculture, Bloomington, MN, USA (Vol. 1619, No. 6).

2

Bring, J. 1994. How to Standardize Regression Coefficients. The American Statistician 48(3): 209-213. https://doi.org/10.1080/00031305.1994.10476059

10.1080/00031305.1994.10476059
3

Cankaya, S., Balkaya, A., Karaagac, O. 2010. Canonical correlation analysis for the determination of relationships between plant characters and yield components in red pepper (Capsicum annuum L. var. conoides (Mill.) Irish) genotypes. Spanish Journal of Agricultural Research 8(1): 67-73. https://doi.org/10.5424/sjar/2010081-1144

10.5424/sjar/2010081-1144
4

Chen, R., Zhang, C., Xu, B., Zhu, Y., Zhao, F., Han, S., Yang, G., Yang, H. 2022. Predicting individual apple tree yield using UAV multi-source remote sensing data and ensemble learning. Computers and Electronics in Agriculture 201: 107275. https://doi.org/10.1016/j.compag.2022.107275

10.1016/j.compag.2022.107275
5

Delavarpour, N., Koparan, C., Nowatzki, J., Bajwa, S., Sun, X. 2021. A technical study on UAV characteristics for precision agriculture applications and associated practical challenges. Remote Sensing 13(6): 1204. https://doi.org/10.3390/rs13061204

10.3390/rs13061204
6

FAO (Food and Agriculture Organization of the United Nations). 2023. World Food Situation Accessed in https://www.fao.org/worldfoodsituation/foodpricesindex/en/ on 9 June 2024.

7

García-Martínez, H., Flores-Magdaleno, H., Khalil-Gardezi, A., Ascencio-Hernández, R., Tijerina-Chávez, L., Vázquez-Peña, M.A., Mancilla-Villa, O.R. 2020. Digital count of corn plants using images taken by unmanned aerial vehicles and cross correlation of templates. Agronomy 10(4): 469. https://doi.org/10.3390/agronomy10040469

10.3390/agronomy10040469
8

Haboudane, D., Miller, J.R., Tremblay, N., Zarco-Tejada, P.J., Dextraze, L. 2002. Integrated narrow-band vegetation indices for prediction of crop chlorophyll content for application to precision agriculture. Remote sensing of environment 81(2-3): 416-426. https://doi.org/10.1016/S0034-4257(02)00018-4

10.1016/S0034-4257(02)00018-4
9

Hu, J., Feng, H., Wang, Q., Shen, J., Wang, J., Liu, Y., Feng, H., Yang, H., Guo, W., Qiao, H., Niu, Q., Yue, J. 2024. Pretrained Deep Learning Networks and Multispectral Imagery Enhance Maize LCC, FVC, and Maturity Estimation. Remote Sensing 16(5): 784. https://doi.org/10.3390/rs16050784

10.3390/rs16050784
10

Huete, A. R. 1988. A soil-adjusted vegetation index (SAVI). Remote sensing of environment 25(3): 295-309.

10.1016/0034-4257(88)90106-X
11

Onoyama, H., Ryu, C., Suguri, M., Iida, M. 2018. Estimation of rice protein content before harvest using ground-based hyperspectral imaging and region of interest analysis 721-734. https://doi.org/10.1007/s11119-017-9552-3

10.1007/s11119-017-9552-3
12

Intergovernmental Panel of Climate Change. 2022. Climate Change 2022: Impacts, Adaptation and Vulnerability. https://doi.org/10.1017/9781009325844

10.1017/9781009325844
13

Kang, Y., Nam, J., Kim, Y., Lee, S., Seong, D., Jang, S., Ryu, C. 2021. Assessment of regression models for predicting rice yield and protein content using unmanned aerial vehicle-based multispectral imagery. Remote Sensing 13(8): 1508. https://doi.org/10.3390/rs13081508

10.3390/rs13081508
14

Kang, Y.S., Jang, S.H., Park, J.W., Song, H.Y., Ryu, C.S., Jun, S.R., Kim, S.H. 2020. Yield prediction and validation of onion (Allium cepa L.) using key variables in narrowband hyperspectral imagery and effective accumulated temperature. Computers and Electronics in Agriculture 178: 105667. https://doi.org/10.1016/j.compag.2020.105667

10.1016/j.compag.2020.105667
15

KREI (Korea Rural Economic Institute). 2017. Current status and improvement tasks of the dried pepper industry. [in Korean]

16

Kumar, C., Mubvumba, P., Huang, Y., Dhillon, J., Reddy, K. 2023. Multi-stage corn yield prediction using high-resolution UAV multispectral data and machine learning models. Agronomy 13(5): 1277. https://doi.org/10.3390/agronomy13051277

10.3390/agronomy13051277
17

Lewis, C.D. 1982. Industrial and business forecasting methods: A practical guide to exponential smoothing and curve fitting.

18

Li, B., Xu, X., Zhang, L., Han, J., Bian, C., Li, G., Liu, J., Jin, L. 2020. Above-ground biomass estimation and yield prediction in potato by using UAV-based RGB and hyperspectral imaging. ISPRS Journal of Photogrammetry and Remote Sensing 162: 161-172. https://doi.org/10.1016/j.isprsjprs.2020.02.013

10.1016/j.isprsjprs.2020.02.013
19

Marcial-Pablo, M.J., Gonzalez-Sanchez, A., Jimenez-Jimenez, S.I., Ontiveros-Capurata, R.E., Ojeda-Bustamante, W. 2018. Estimation of vegetation fraction using RGB and multispectral images from UAV (pp. 420-438). International Journal of Remote Sensing. https://doi.org/10.1080/01431161.2018.1528017

10.1080/01431161.2018.1528017
20

Naji, T.A. 2018. Study of vegetation cover distribution using DVI, PVI, WDVI indices with 2D-space plot. In Journal of physics: conference series (Vol. 1003, p. 012083). https://doi.org/10.1088/1742-6596/1003/1/012083

10.1088/1742-6596/1003/1/012083
21

Park C.G, Lee G.E. 2014. Linearity test statistics in a simple regression model. The Korean Data & Information Science Society 25(2): 305-315. [in Korean] https://doi.org/10.7465/jkdi.2014.25.2.305

10.7465/jkdi.2014.25.2.305
22

Ryu, C., Suguri, M., Umeda, M. 2009. Model for predicting the nitrogen content of rice at panicle initiation stage using data from airborne hyperspectral remote sensing. Biosystems Engineering 104(4): 465-475. https://doi.org/10.1016/j.biosystemseng.2009.09.002

10.1016/j.biosystemseng.2009.09.002
23

Ryu, J.S., Oh, D.H., and Cho, J.I. 2021. Simple method for extracting the seasonal signals of photochemical reflectance index and normalized difference vegetation index measured using a spectral reflectance sensor. Journal of Integrative Agriculture 20(7): 1969-1986. https://doi.org/10.1016/S2095-3119(20)63410-4

10.1016/S2095-3119(20)63410-4
24

Seber, G.A., Lee, A.J. 2012. Linear regression analysis. John Wiley & Sons.

25

Shrestha, N. 2020. Detecting multicollinearity in regression analysis. American Journal of Applied Mathematics and Statistics 8(2): 39-42. https://doi.org/10.12691/ajams-8-2-1

10.12691/ajams-8-2-1
26

Sripada, R.P., Heiniger, R.W., White, J.G., Meijer, A.D. 2006. Aerial color infrared photography for determining early in‐season nitrogen requirements in corn. Agronomy Journal 98(4): 968-977. https://doi.org/10.2134/agronj2005.0200

10.2134/agronj2005.0200
27

Stehr, N.J. 2015. Drones: The newest technology for precision agriculture. Natural Sciences Education 44(1): 89-91. https://doi.org/ 10.4195/nse2015.04.0772

10.4195/nse2015.04.0772
28

Su, J., Zhu, X., Li, S., Chen, W.H. 2023. AI meets UAVs: A survey on AI empowered UAV perception systems for precision agriculture. Neurocomputing 518: 242-270. https://doi.org/10.1016/j.neucom.2022.11.020

10.1016/j.neucom.2022.11.020
29

Xue, J., Su, B. 2017. Significant remote sensing vegetation indices: A review of developments and applications. Journal of sensors 2017. https://doi.org/10.1155/2017/1353691

10.1155/2017/1353691
30

Yaghobi, S., Heidarizadi, Z., Mirzapour, H. 2019. Comparing NDVI and RVI for forest density estimation and their relationships with rainfall (Case study: Malekshahi, Ilam Province). Environmental Resources Research 7(2): 117-128.

31

Yang, J., Rahardja, S., Fränti, P. 2019. Outlier detection: how to threshold outlier scores?. In Proceedings of the international conference on artificial intelligence, information processing and cloud computing pp. 1-6. New York, United States. https://doi.org/10.1145/3371425.3371427

10.1145/3371425.3371427
32

Yang J.Y., Jeong S.Y., Lee H.S. 2022. Based on the predictive model and Visualization-regression analysis according to the resulting variables using R. Journal of Health Informatics and Statistics. 47: 21-30. [in Korean] https://doi.org/10.21032/jhis.2022.47.S2.S21

10.21032/jhis.2022.47.S2.S21
33

Yang, S., Li, L., Fei, S., Yang, M., Tao, Z., Meng, Y., Xiao, Y. 2024. Wheat yield prediction using machine learning method based on UAV remote sensing data. Drones 8(7): 284. https://doi.org/10.3390/drones8070284

10.3390/drones8070284
34

Yohanani, E., Frisch, A., Lukyanov, V., Cohen, S., Teitel, M., Tanny, J. 2022. Estimating evapotranspiration of screenhouse banana plantations using artificial neural network and multiple linear regression models. Water 14(7): 1130. https://doi.org/10.3390/ w14071130

10.3390/w14071130
35

Yoon J.B, Yoon Y.N, Kim Y.H. 2021. Utilization of Vegetation Indices in Agricultural Field. Journal of Agriculture & Life Science. [in Korean]

36

Zhu, P., Burney, J., Chang, J., Jin, Z., Mueller, N. D., Xin, Q., Xu, J., Makowski, D. Ciais, P. 2022. Warming reduces global agricultural production by decreasing cropping frequency and yields. Nature Climate Change 12(11): 1016-1023. https://doi.org/10.1038/ s41558-022-01492-5

10.1038/s41558-022-01492-5
페이지 상단으로 이동하기