

Introduction
Soil water status monitoring sensors
Crop water stress sensors
Remote sensing technology for irrigation monitoring of orchards
Concluding remarks and future perspectives
Introduction
Orchard fruits are kinds of fruits grown in agricultural fields that are maintained to maximum yield and serve an important part of human diets by offering rich vitamins, minerals, and dietary fiber (Mani and Negi, 2024). Orchard fruits such as apples, peaches, oranges, nectarines, and pears are valuable commodities in domestic and international markets, providing essential nutrients like vitamin C, A, B9, dietary fiber, potassium, magnesium, and natural sugars (Mrázová et al., 2021). High-quality orchard fruits are produced through effective automated irrigation practices in orchard operations to ensure optimal growth, reduced crop water stress, and economic sustainability (El Chami et al., 2023).
The global orchard fruits as revealed by the 2024 report, the fresh apple, grapes, and pears industry is expected to rebound to 83.1 million metric tons, with increased supplies from China, South Africa, and the United States of America compensating for reductions in Turkey and the European Union (Caggiati, 2024). Sensing technology has improved global orchard fruit production, reducing water usage by 20% and increasing yield by 30%. Early pest detection and irrigation techniques have also improved water efficiency, while fruit maturity sensors reduce post-harvest losses (Zapata-García et al., 2023). Automated remote irrigation systems enhance global fruit supply, and the worldwide fresh fruit market earned $674.5 billion in 2023, with a compound yearly growth rate of 6.79% (SkyQuest, 2023). Therefore, the appropriate sensing technologies in automated remote irrigation measures are vital in sustaining orchard fruit production expansion by emphasizing the economic sectors and long-term global impact.
The orchard sector in South Korea was dominated by six primary fruits such as apples, peaches, tangerines, grapes, pears, and persimmons, which together accounted for 89.6% of total fruit output, with apples being the largest (24.8%), contributing significantly to the country total value (Seok and Kim, 2023). Notably, apples were projected to decrease by 23.2%, pears by 19.7%, grapes by 1.7%, and persimmons by 13.5%, Korean orchard industry faces production quantity challenges (K-Foodtrade, 2023). Sensing technology was used in the South Korean orchard sectors to increase crop production and water efficiency, proving its dedication to agricultural innovation and sustainability.
Sensor technology in orchard fruits has evolved over decades, starting with basic sensors in the 1970s and 1980s to monitor temperature, humidity, and soil moisture (Lee et al., 2010). The 1990s saw the advancement of remote sensing technology, enabling extensive monitoring through satellite imagery and aircraft surveys (Andreou et al., 2022). In the 2000s, wireless sensor networks revolutionized real-time monitoring and data accuracy, while precise agricultural technology in the 2010s allowed site-specific control and optimal resource utilization in orchards (Wolfert et al., 2017). The integration of the Internet of Things (IoT) in the 2010s and 2020s revolutionized orchard control by creating networked sensor systems (Kumar et al., 2019). In recent years, there has been a growing focus on advanced data analytics and artificial intelligence.
Current trends in sensor technology for remote monitoring automated orchard irrigation include wireless networks, low-power sensors, robotic sensors, machine learning, edge computing, and artificial intelligence for cost-effective and scalable solutions (Mowla et al., 2023). Low-power sensors enhance autonomy and sustainability, while machine learning and AI applications improve predictive modeling and decision-making, and blockchain technology addresses data security concerns (Fan et al., 2023). Edge computing, advanced imaging technologies, robotic sensors, and automation enhance precision agriculture, ensuring flexibility and scalability through open standards and interoperability (Sharma et al., 2024). This review explores sensor technologies for remote orchard monitoring by discussing various types and applications and aiming to maximize the efficiency of automated orchard irrigation systems.
Soil water status monitoring sensors
Soil water status sensors are instruments designed to measure the quantity of water in the soil using various technologies such as capacitance, resistivity, and time-domain reflectometry (Quemada et al., 2021). Soil water sensors provide critical information for optimizing irrigation, conserving water, improving crop yields and quality, and minimizing the environmental impact of agricultural practices (Eshete et al., 2020).
The identification and classification of soil water status monitoring sensors became significant for improving water management strategies, and soil water content sensors are categorized into numerous categories depending on their measuring methods and applicability for orchard scenarios (Segovia-Cardozo et al., 2022). Tensiometers, capacitance sensors, and time domain reflectometry (TDR) sensors are commonly used due to their reliability and accuracy (Mukhlisin et al., 2021). Tensiometers measure soil water potential directly, while capacitance and TDR sensors assess soil moisture content indirectly, offering non-invasive, continuous monitoring and accurate measurements at various depths (Ruszczak and Boguszewska-Mańkowska, 2022). Capacitance sensors typically have a measurement range of 0 to 50% volumetric water content with a sensor capacity of up to 100 sensors per system, making them suitable for large orchard operations (Okasha et al., 2021). Tensiometers and TDR sensors enable orchard managers to monitor soil water status, optimize irrigation scheduling, reduce water waste, and enhance productivity by integrating them into automated irrigation systems. Table 1 summarizes a detailed comparison of soil water content monitoring sensors suitable for orchard field irrigation monitoring.
Table 1.
Comparison of various soil water content monitoring sensors for orchard field irrigation management.
| Sensor types | Water potential sensor | Water content sensor | Tensiometer sensor |
| Description (example) |
Measures the energy state of soil water and water availability to plants. |
Measures the volumetric water content of the soil. |
Measures the tension of water in the soil, and indicator of water stress |
| Model | Teros 21 | TDR-310H | 212 - 12 SR |
| Accuracy range | ± 10% | ± 0.25% | +3-2-3% |
| Operating temperature | -40 to +60℃ | -30 to +65℃ | 0.5° to 65°C |
| Operating voltage | 3.5 to 15 volts dc | 3.5 to 15 volts dc | 0.5 to 4.5 volts dc |
| Current drain range | 3.0 mA-10.0 mA | 1.5 mA-2.0 mA | 4 mA-20 mA |
| Measurement duration | NA to 200 ms | 0.2 s to 0.6 s | 6 ms to 48 ms |
| References | Menne et al., 2022 | Leite et al., 2021 | Rasheed et al., 2022 |
Calibration of soil water content sensors was crucial for precise measurements in automated orchard irrigation systems, requiring the selection of representative sites, installation guidelines, and proper depth and spacing (Bogena et al., 2017). Sensor calibration involves methods such as laboratory calibration using soil samples and field calibration against reference sensors (Mane et al., 2024). Fig. 1 shows the dielectric soil moisture calibration methods (the laboratory and field calibration methods).
Laboratory calibration of soil moisture sensors involves two methods, such as wet-up and dry-down. Wet-up involves gradually saturating soil samples, while dry-down starts with a saturated sample and continuously monitors outputs (Holzman et al., 2017). Calibration covers a range of soil moisture conditions, improving transferability across different environments. Both methods are effective, especially for long-term or buried sensors, and field-based calibration may be necessary in some cases (Adla et al., 2020). The true volumetric water content (VWC) was calculated as per the method proposed by Ojo et al. (2015) using the following equation:
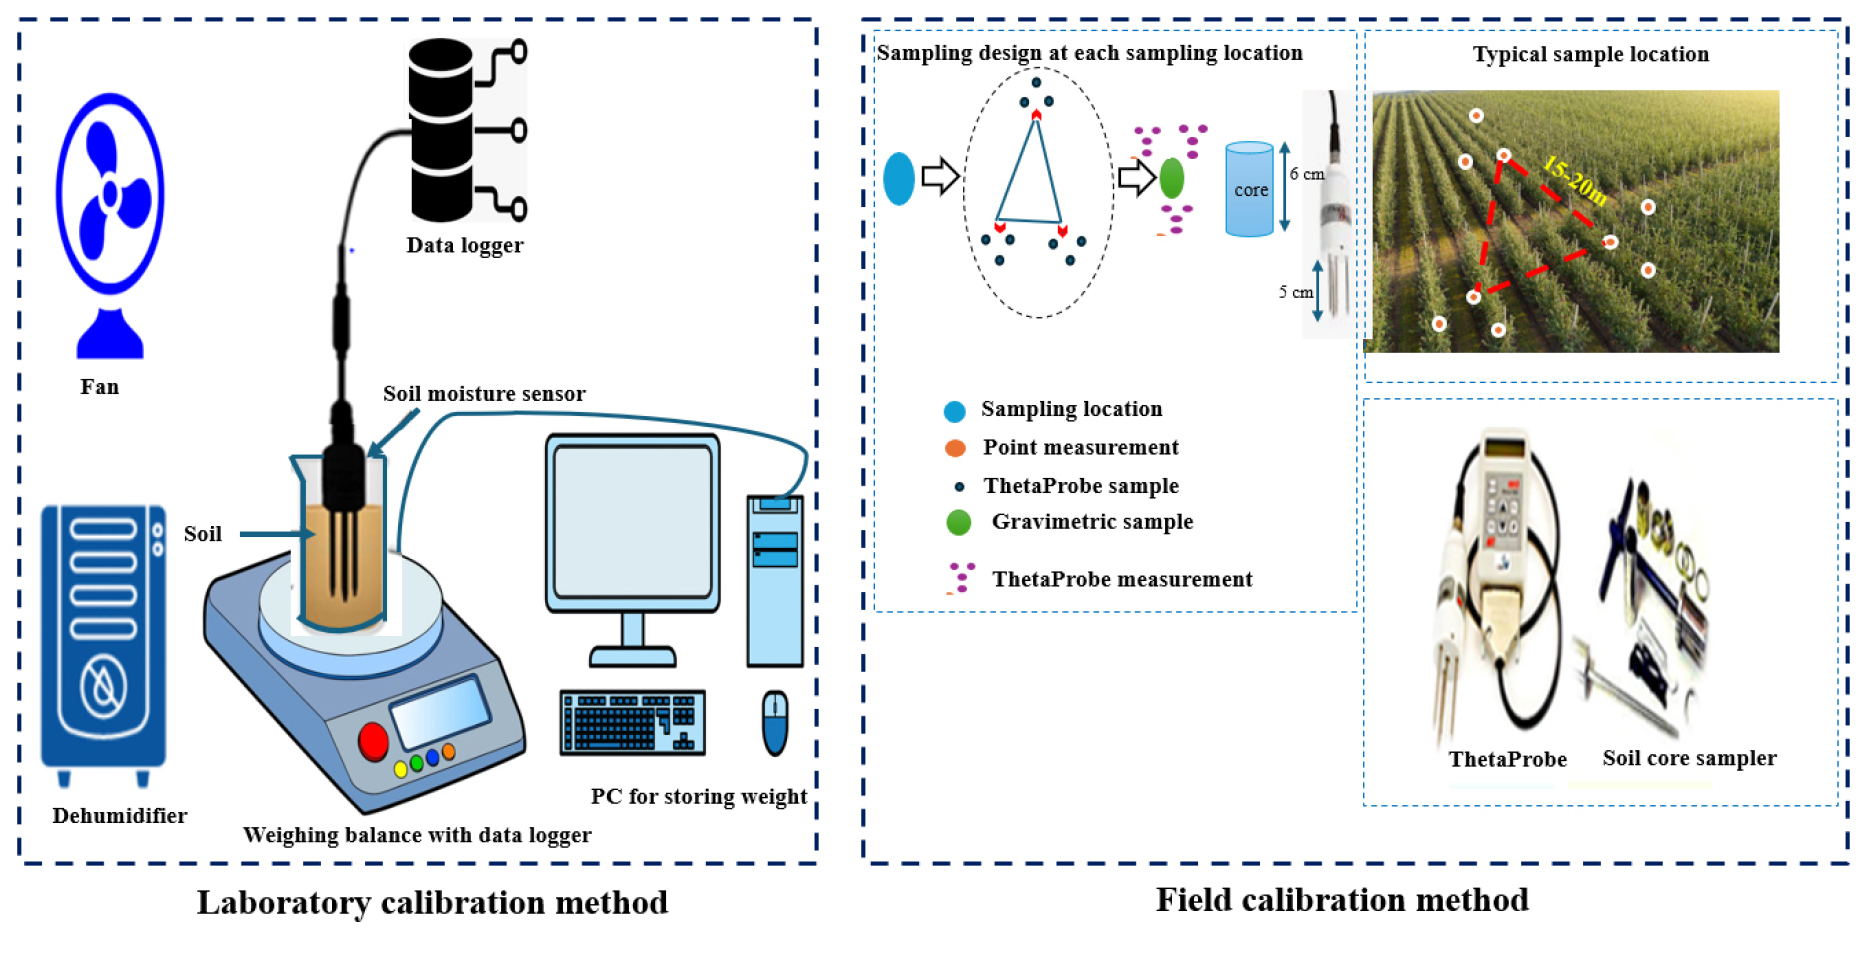
Fig. 1.
An overview of the laboratory and field calibration methods (where the sampling design at each sampling location is shown as a schematic diagram. Three-point measurements at a typical sampling location forming a triangle are for capturing spatial variability. A view of the gravimetric sample collection corresponding to theta probe measurement in the apple field is presented through photographs).
Where represents the soil bulk density, which is defined as the ratio of the mass of dry soil to the total volume of moist soil, represents the total weight, which includes the weight of the wet soil plus the weight of the probe, presents the weight of the sensor probe and represents the dry weight of the soil sample.
Field calibration of dielectric soil moisture sensors was essential for accurate measurements in real-world applications (Caldwell et al., 2018). Chahal et al. (2018) conducted an experiment to determine the effect of the degree of water stress on growth using soil moisture sensors. The findings revealed that the growth index and total leaf area were similar at 100%, 75%, and 50% of soil field capacity (FC) compared to actual values. Field calibration involves selecting representative fields and comparing sensor outputs with gravimetric water content using the oven-dry method, enhancing accuracy by considering real-world conditions (Amankwah et al., 2022). Despite challenges like soil structure changes and time-consuming processes, field calibration is crucial for accurate soil moisture measurements by highlighting the need for ongoing research.
Remote monitoring techniques in orchard systems enable efficient data flow from sensors to cloud platforms. The core components of remote monitoring include sensors, Analog-to-Digital Converters (ADC), solenoid valves, microcontrollers, and cloud infrastructure (Visconti et al., 2020). Sensors in orchards collect vital data like soil moisture, temperature, humidity, and light, converting analog signals into digital data processed by a microcontroller (Rajak et al., 2023). Fig. 2 illustrates the remote monitoring techniques depicting the data flow from sensors to cloud platforms.
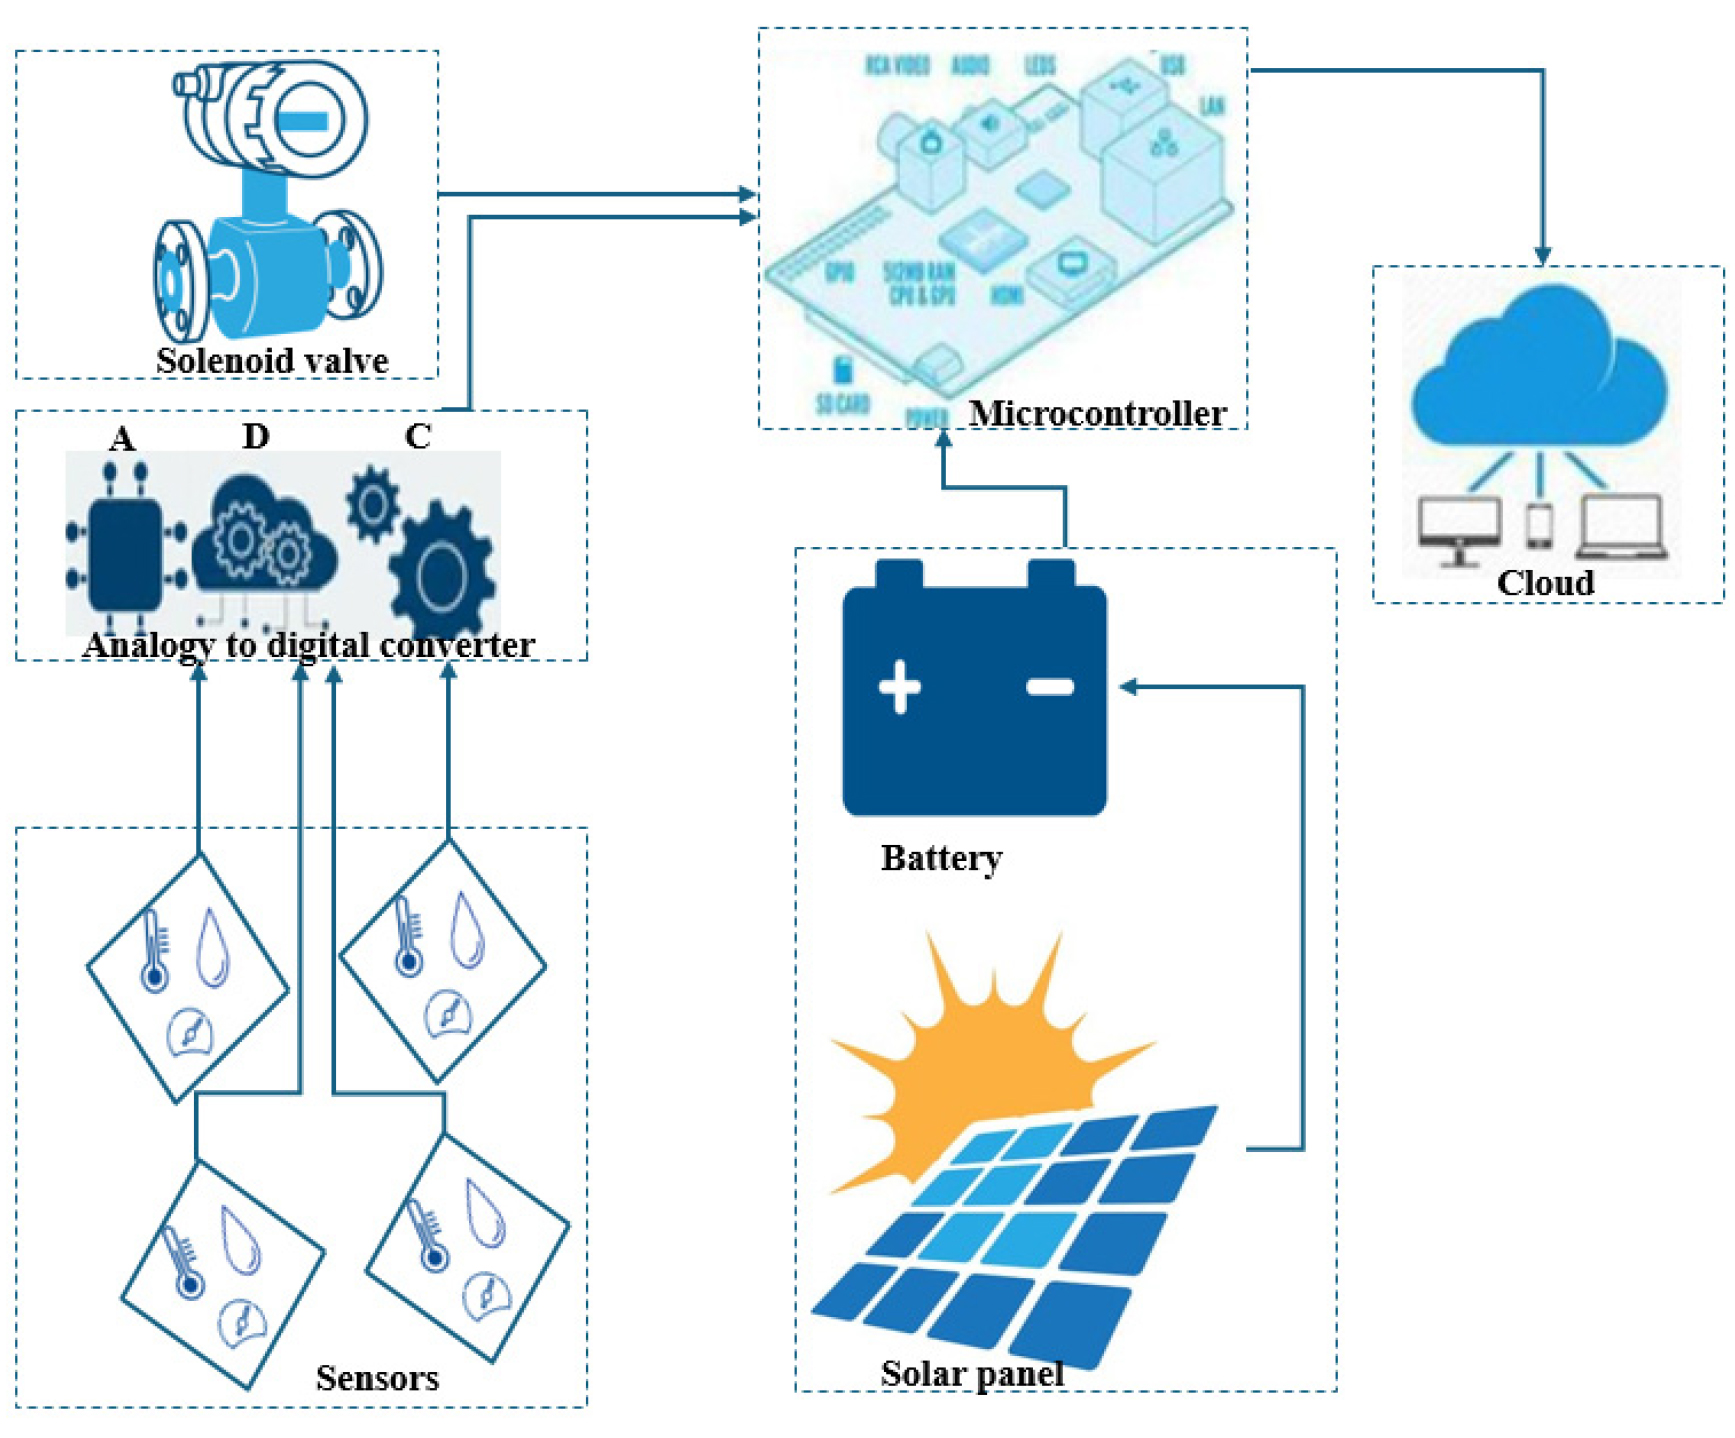
The microcontroller serves as the central processing unit, utilizing programmed algorithms and solenoid valves, manages irrigation processes based on sensor data, determines optimal schedules, and controls water flow to individual zones (Abbas et al., 2024). Solar panels provide renewable energy for charging batteries, reducing dependency on conventional grids and enhancing resilience in remote or off-grid orchard locations, ensuring uninterrupted functionality (Olabode et al., 2021). Remote monitoring in automated orchard irrigation involves transmitting data to cloud-based platforms, enabling real-time control from any location via Wi-Fi or cellular networks, allowing farmers or agronomists to access and analyze data.
Crop water stress sensors
Crop water stress detection uses sensor technologies to monitor plant health and water status, including soil moisture, temperature, humidity, pressure chambers, infrared thermometers, and satellite imagery (Saleem et al., 2024). These technologies enable accurate assessment and management of crop water stress, improving water use efficiency and agricultural productivity (King and Shellie, 2023).
Plant response to water stress involves physiological, biochemical, and morphological changes to cope with insufficient soil water (Zia et al., 2021). The crop evapotranspiration (ETc) model offers two variations of crop coefficients such as the single crop coefficient (Kc) and dual crop coefficient methods, in which the single crop coefficient (Kc) expresses both plant transpiration and soil evaporation (Gong et al., 2019). The dual crop coefficient approach accounts for plant transpiration (Kcb) and soil evaporation with Kcb is then multiplied by a water stress coefficient (Ks) ranging from 0 to 1 to consider the reduction in evapotranspiration (ET) due to soil moisture depletion. The relationship between Ks and the crop water stress index (CWSI) is defined by Equation (2), where Ks equals 1 minus CWSI.
Various methods have been explored for determining the water stress coefficient to estimate crop ETc under different deficit irrigation scenarios accurately (Tang et al., 2019).
Stress quantification through plant-based approaches involves directly measuring leaf water potential using a pressure chamber, and this method accurately measures leaf water potential, providing valuable insights into the mean soil water potential near plant roots (Rodriguez-Dominguez et al., 2022). Leaf water content and analysis (RWC) and equivalent water thickness (EWT) analysis offer insights into plant hydration but are slow, destructive, and impractical for strongly isohydric crops, equivalent water thickness (EWT) is calculated from fresh weight (FW), dry weight (DW), and leaf area (LA), assesses water content with limited temporal and spatial resolution.
For the canopy level, equivalent water thickness is derived by scaling EWT with leaf area index (LAI), where LAI is the one-sided green leaf area per unit ground area (Kovar et al., 2019).
Relative water content (RWC), derived from leaf weight and turgid weight (TW), compares leaf water content and serves as an indicator of vegetation status.
Both leaf water content and leaf weight are effective indicators for scheduling automated orchard irrigation in diverse crops. The canopy water stress index (CWSI) derived from canopy temperature is widely used to assess plant water status and schedule orchard irrigation (Wang and Li, 2013). As soil moisture decreases, stomatal conductance, and transpiration decline, causing an increase in leaf temperature. The lower baseline represents the temperature difference between the canopy (Tc) and air (Ta) of a well-watered crop transpiring at the maximum potential rate, while the upper baseline represents the temperature difference (Tc–Ta) of a non-transpiring crop.
Where Tc is the canopy temperature (°C), Ta is the air temperature (°C), Tnws is the non-water-stressed canopy temperature (°C), and Tdry is the water-stressed canopy temperature (°C) (Jamroen et al., 2020).
Crop water stress was detected, based on satellites; this involves various satellites with distinct applications. The advanced microwave scanning radiometer for EOS offers high-efficiency passive microwave soil moisture analysis, but data files are limited (Chen et al., 2021). NISAR provides precise global soil moisture maps every 6-12 days, Tandem-L offers millimeter-level data at a premium cost, and Sentinel-1 focuses on dynamics observation with a 5-20 m resolution (Lal et al., 2023). Soil moisture active passive analyzes vegetation status and soil surface but faces a high likelihood of mission failure with a 9 km resolution (Colliander et al., 2022).
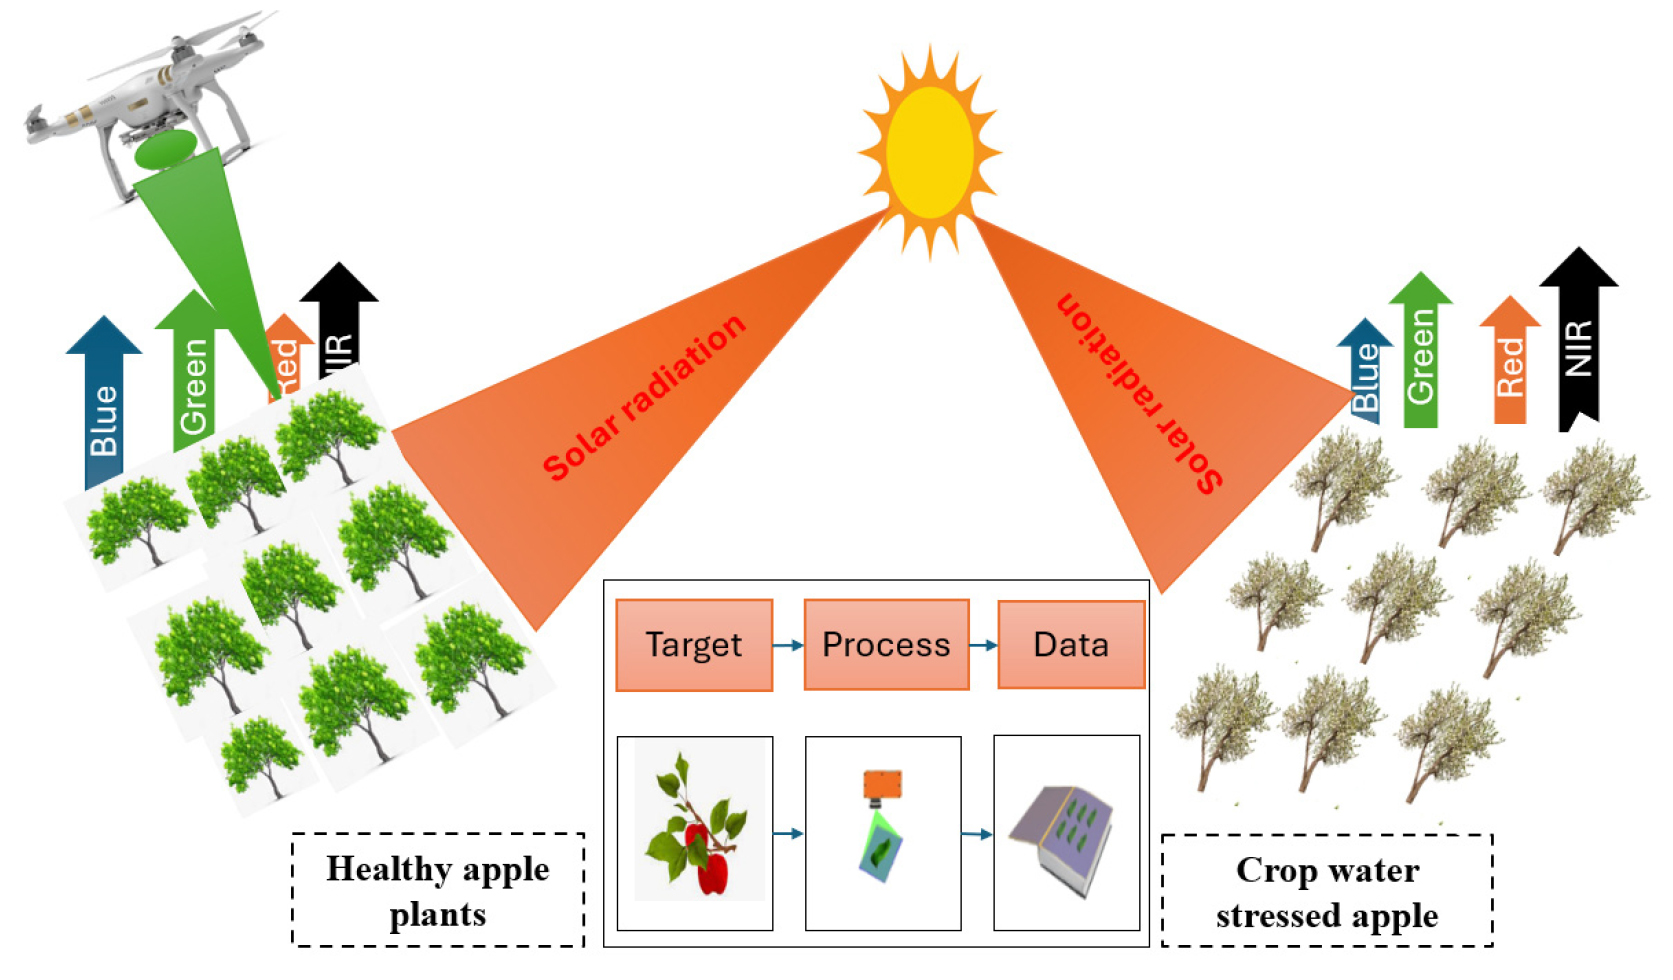
Multispectral sensing systems were another way of detecting crop water stress, this includes both UAV remote and spaceborne approaches (Ahmad et al., 2021). The AIRPHEN multispectral camera used in UAV remote systems offers advantages like high resolution, precise detection of crop water stress (CWS), cost-effectiveness, and RGB color band availability (Lück-Vogel et al., 2010). Spaceborne systems use satellites like landsat, orb view, worldview, IKONOS, quick bird, and SPOT-5, playing a vital role in determining agricultural water stress while hyperspectral sensors capture a wide range of wavelengths, enabling hyperspectral plant characteristics (Baraldi et al., 2010). Hyperspectral data guide irrigation decisions by offering nuanced information about orchard conditions.
Fig. 3, shows the process of collecting data with a hyperspectral camera system for crop health and stress levels. This system uses continuous spectral analysis to detect crop reactions under environmental conditions and estimate crop water stress. The wavelength band ranges from 8 to 14 µm, and atmospheric correction, emissivity, and temperature separation methods are applied for hyperspectral crop water stress determination (Ahmad et al., 2021). The system considers radiance in the n-band wavelength, which was correlated with soil temperature and emissivity parameters, to analyze surface temperatures using the hyperspectral remote-sensing system for crop water stress analysis.
Hyperspectral remote sensing for crop water stress has been underutilized due to high costs, low spectral emissivity, and limited detection of minor crop changes. This Study shows that specific spectral characteristics are relevant to different crop types. To improve hyperspectral remote sensing applications, flexible, reliable, and cheap mathematical algorithms are needed. Satellite mission designs, such as landsat surface temperature monitors, hyperspectral infrared images, and high-resolution temperature and spectral emission mappers, are needed to acquire crop water stress on a global scale.
Remote sensing technology for irrigation monitoring of orchards
A key component of automated orchard irrigation and remote sensing technology uses sensors often placed on different platforms such as satellites, drones, or ground-based instruments to gather data remotely (Jafarbiglu and Pourreza, 2022). Sensing technologies improve irrigation management and provide valuable insights without physical contact, enhancing the overall health of the orchard.
Remote sensing technology has shown significant success in fruit-type classification and analysis, with apple orchards achieving over 90% classification accuracy and peach orchards reaching R2 values exceeding 85% as shown in Table 2, for indicating potential for further exploration and adoption in orchard management practices.
Table 2.
Fruit detection methods utilizing remote sensing technologies.
| Fruit type |
Dataset utilized | Method proposed | Accuracy information provided | Reference |
| Apple | UAV | Deep Learning (R-CNN) | > 90% F-score | Sekharamantry et al., 2023 |
| Apple | UAV | Structure-from-motion | R2 = ranging from 0.81 to 0.91 | Hobart et al., 2020 |
| Apple | LiDAR | Alpha-shape algorithm & thresholding | 99% detection accuracy | Tsoulias et al., 2020 |
| Apple |
Aerial images |
Marker Controlled Watershed Segmentation | 87%-97% detection accuracy | Sabzi et al., 2018 |
| Peach-Nectarine | UAV |
Adaptive threshold and morphological operation | > 85% R2 values | Park et al., 2017 |
| Multiple Trees | UAV | Deep learning (YOLOv4) | 94% F-score | Colkesen et al., 2023 |
| Multiple Trees | UAV |
Marker-controlled segmentation algorithm |
F-scores 0.88-0.99 (taxus), 0.55-0.61 (olive) | Ottoy et al., 2022 |
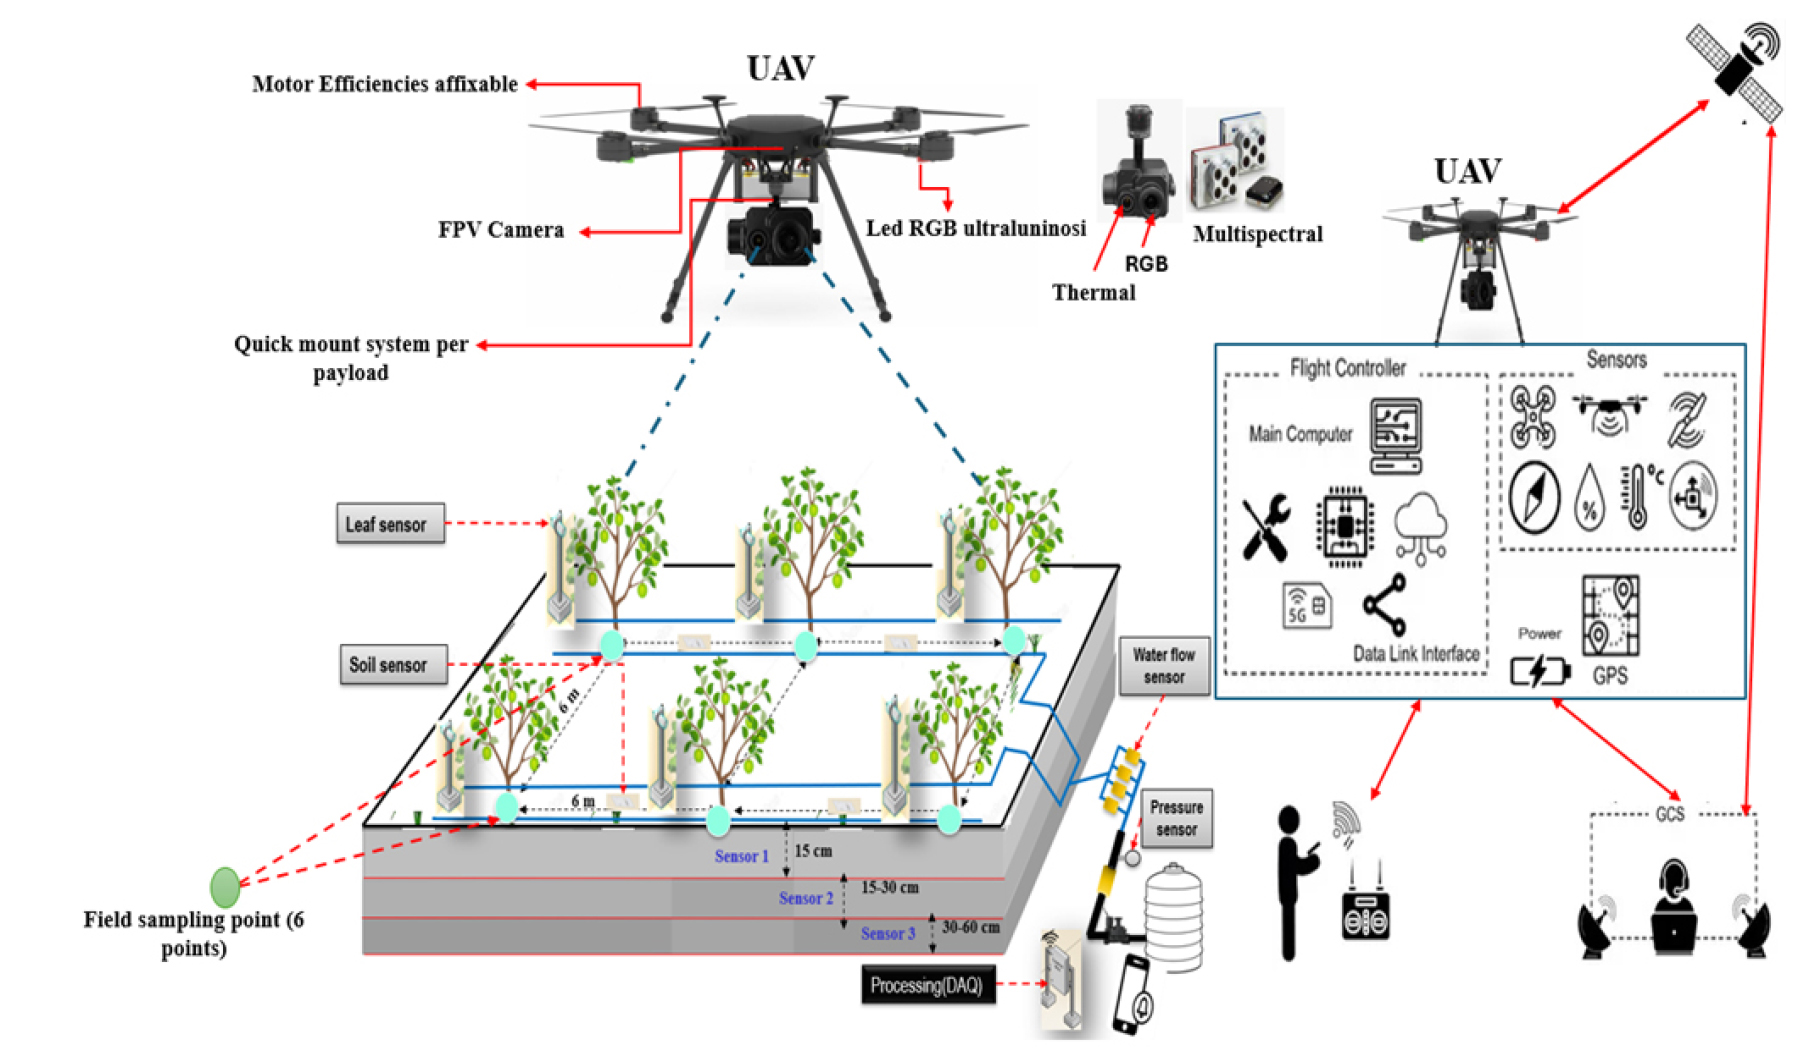
The advanced technology known as unmanned aerial vehicle (UAV)-based crop monitoring facilitated the streamlines of the evaluation of crop health using high-resolution aerial photography, and it considerably aids automated orchard watering (Oliveira et al., 2018). UAV technique provides information on orchard health, which is important for maintaining maximum yield and minimizing any disruptions to food supplies and changes in the market. Combining UAV photography with wireless communication technologies such as the micro air vehicle link protocol enables efficient data collecting, which is essential for accurate monitoring (Atoev et al., 2017). Fig. 4, illustrates the key components of unmanned aerial vehicle (UAV) command processing and communication technologies including the power unit, communication module, main computing device, and sensor board, each serving specific roles used for orchard monitoring. The power unit ensures prolonged operation without frequent charging, while the main computing device processes data collected from various sensors and components. Communication between the UAV and ground control station (GCS) is facilitated through a dedicated link, monitored for detection and control purposes (Sihag et al., 2023). The UAV architecture encompasses its airframe, main computer, sensors/payloads, communication link, and ground control station, with each component playing a vital role in enabling autonomous flight and mission execution.
The UAV captures a variety of wavelengths, including blue, green, red, red-edge, and near-infrared, for comprehensive data analysis, enabling the identification of stressed areas within orchards through vegetation index maps (Hashimoto et al., 2019). One of the primary vegetation indices presented in equation (7) utilized in this process is called the normalized difference vegetation index (NDVI) (Giordan et al., 2020).
Here, NIR represents near-infrared reflectance, and RED represents red-band reflectance. NDVI values typically range between -1 and +1, with values close to 0 indicating low vegetation density and values closer to +1 indicating high density (Raeva et al., 2019). Additionally, the green NDVI (GNDVI) formula, was presented in (Poley and McDermid, 2020)
Orchards require precise and accurate monitoring through the use of UAV systems, which can be tailored to specific field requirements for optimal crop growth. Furthermore, other indices such as the difference vegetation index (DVI), Green DVI (GDVI), and visible atmospherically resistant index (VARI) were provided to determine crop health (Meivel and Maheswari, 2020). Equations (9), (10), and (11) respectively represent the formulas for DVI, GDVI, and VARI:
Incorporating these indicators, Combined with contemporary UAV technology, allows for effective monitoring and management of orchard irrigation systems, eventually maximizing crop yield and health.
In the context of remote sensing and vegetation studies, the symbol “R” represents reflectance at various wavelengths or wavebands. Specifically, “Rred,” “Rgreen,” and “Rblue” denote reflectance in the visible red, green, and blue wavebands, respectively.
Remote sensing technology is revolutionizing automated orchard irrigation, offering precise and efficient management through fruit-type classification, satellite imaging, unmanned aerial vehicles, and vegetation indices, enhancing productivity and resource allocation.
Table 3.
Vegetation indices, applications, and wavebands for chlorophyll and water content estimation.
|
Vegetation Indices | Index | Wavebands | Application | Reference |
|
Leaf or canopy chlorophyll indices | Chlorophyll indices |
•CIgreen = (RNIR/Rgreen) - 1 •CIred edge = (RNIR/Rred edge) - 1 |
Leaf area index, gross primary productivity, chlorophyll content | Yu et al., 2014 |
|
Normalized pigment chlorophyll ratio index (NPCI) |
•NPCI = (R660 - R460)/ (R660 + R460) •NPCI = (R680 - R430)/ (R680 + R430) |
Crop canopy chlorophyll estimation | Kior et al., 2021 | |
|
Modified chlorophyll and reflectance index (MCARI) |
•MCARI = [(R700 - R670) - 0.2 × (R700 - R550)] × (R700/R670) |
Canopy chlorophyll estimation | Jin et al., 2014 | |
|
Water content indices | Water balance index (WBI) | •WBI = R970/R900 or R905/R980 |
Water content estimation | Deng et al., 2019 |
|
Normalized difference water content (NDWI) | •NDWI = (R800 - R680)/ (R800 + R680) |
Water content estimation | Caturegli et al., 2020 | |
|
Shortwave infrared water stress index (SIWSI) |
•SIWSI = (R1628 to R1652) - (R841 to R876)/ (R1628 to R1652) + (R841 to R876) |
Water content and stress assessment | Hatfield et al., 2019 |
Concluding remarks and future perspectives
Sensor technologies for scheduling automated orchard irrigation rely on assessing water stress through measurements of soil moisture, climatic data, and physiological indicators of plant response. However, using sensors for this can be expensive and installation challenging, especially in areas with different types of soil and crops. Traditional plant indicators like leaf water potential and stomatal conductance, although useful, have downsides such as being destructive, labor-intensive, and not suitable for automation. Therefore, there is a need for automated methods that can quickly and reliably estimate how much water plants need without causing damage, making it easier for farmers to use them.
Utilizing hyperspectral sensors mounted on Unmanned Aerial Systems, vegetation indices play a vital role in monitoring plant water status and refining irrigation water management. Although earlier studies reveal significant correlations between remotely sensed parameters like vegetation index and metrics such as leaf area index, stomatal conductance, and leaf water potential, the precision of these associations may not be sufficient for accurately estimating plant water status with just one measurement. Therefore, the adoption of innovative data management techniques becomes imperative, combining both soil-based and plant-based approaches. This integration is essential for advancing scientific understanding and providing irrigators with advanced decision-making tools, particularly in the domain of crop water stress detection.
Remote sensing through unmanned aircraft systems plays a vital role in this study. Challenges persist, such as the impact of various factors on leaf spectral properties beyond plant water status. The thermal and narrow-band hyperspectral imagery aims to provide more precise insights into plant water status. Additionally, the advancement of real-time data analysis accessible to farmers commercially is deemed crucial for effective plant water stress detection, particularly in automated orchard irrigation systems.
Future perspectives in this study hold promise and opportunities. Advancements in sensor technologies and remote sensing methodologies may lead to even more precise and cost-effective solutions. The integration with artificial intelligence and machine learning algorithms can potentially enhance the predictive capabilities of orchard irrigation systems, optimizing resource allocation and mitigating potential challenges. Moreover, the continual refinement and development of sensor technologies could result in more robust and durable sensors, expanding their application in various soil types and environmental conditions. Collaboration between researchers, practitioners, and technology developers will be essential in driving innovation and ensuring the practical implementation of cutting-edge solutions in automated orchard irrigation.